

Timeline Interface
The Timeline tab is organized into three categories:- Request
- Response
- Network Logs
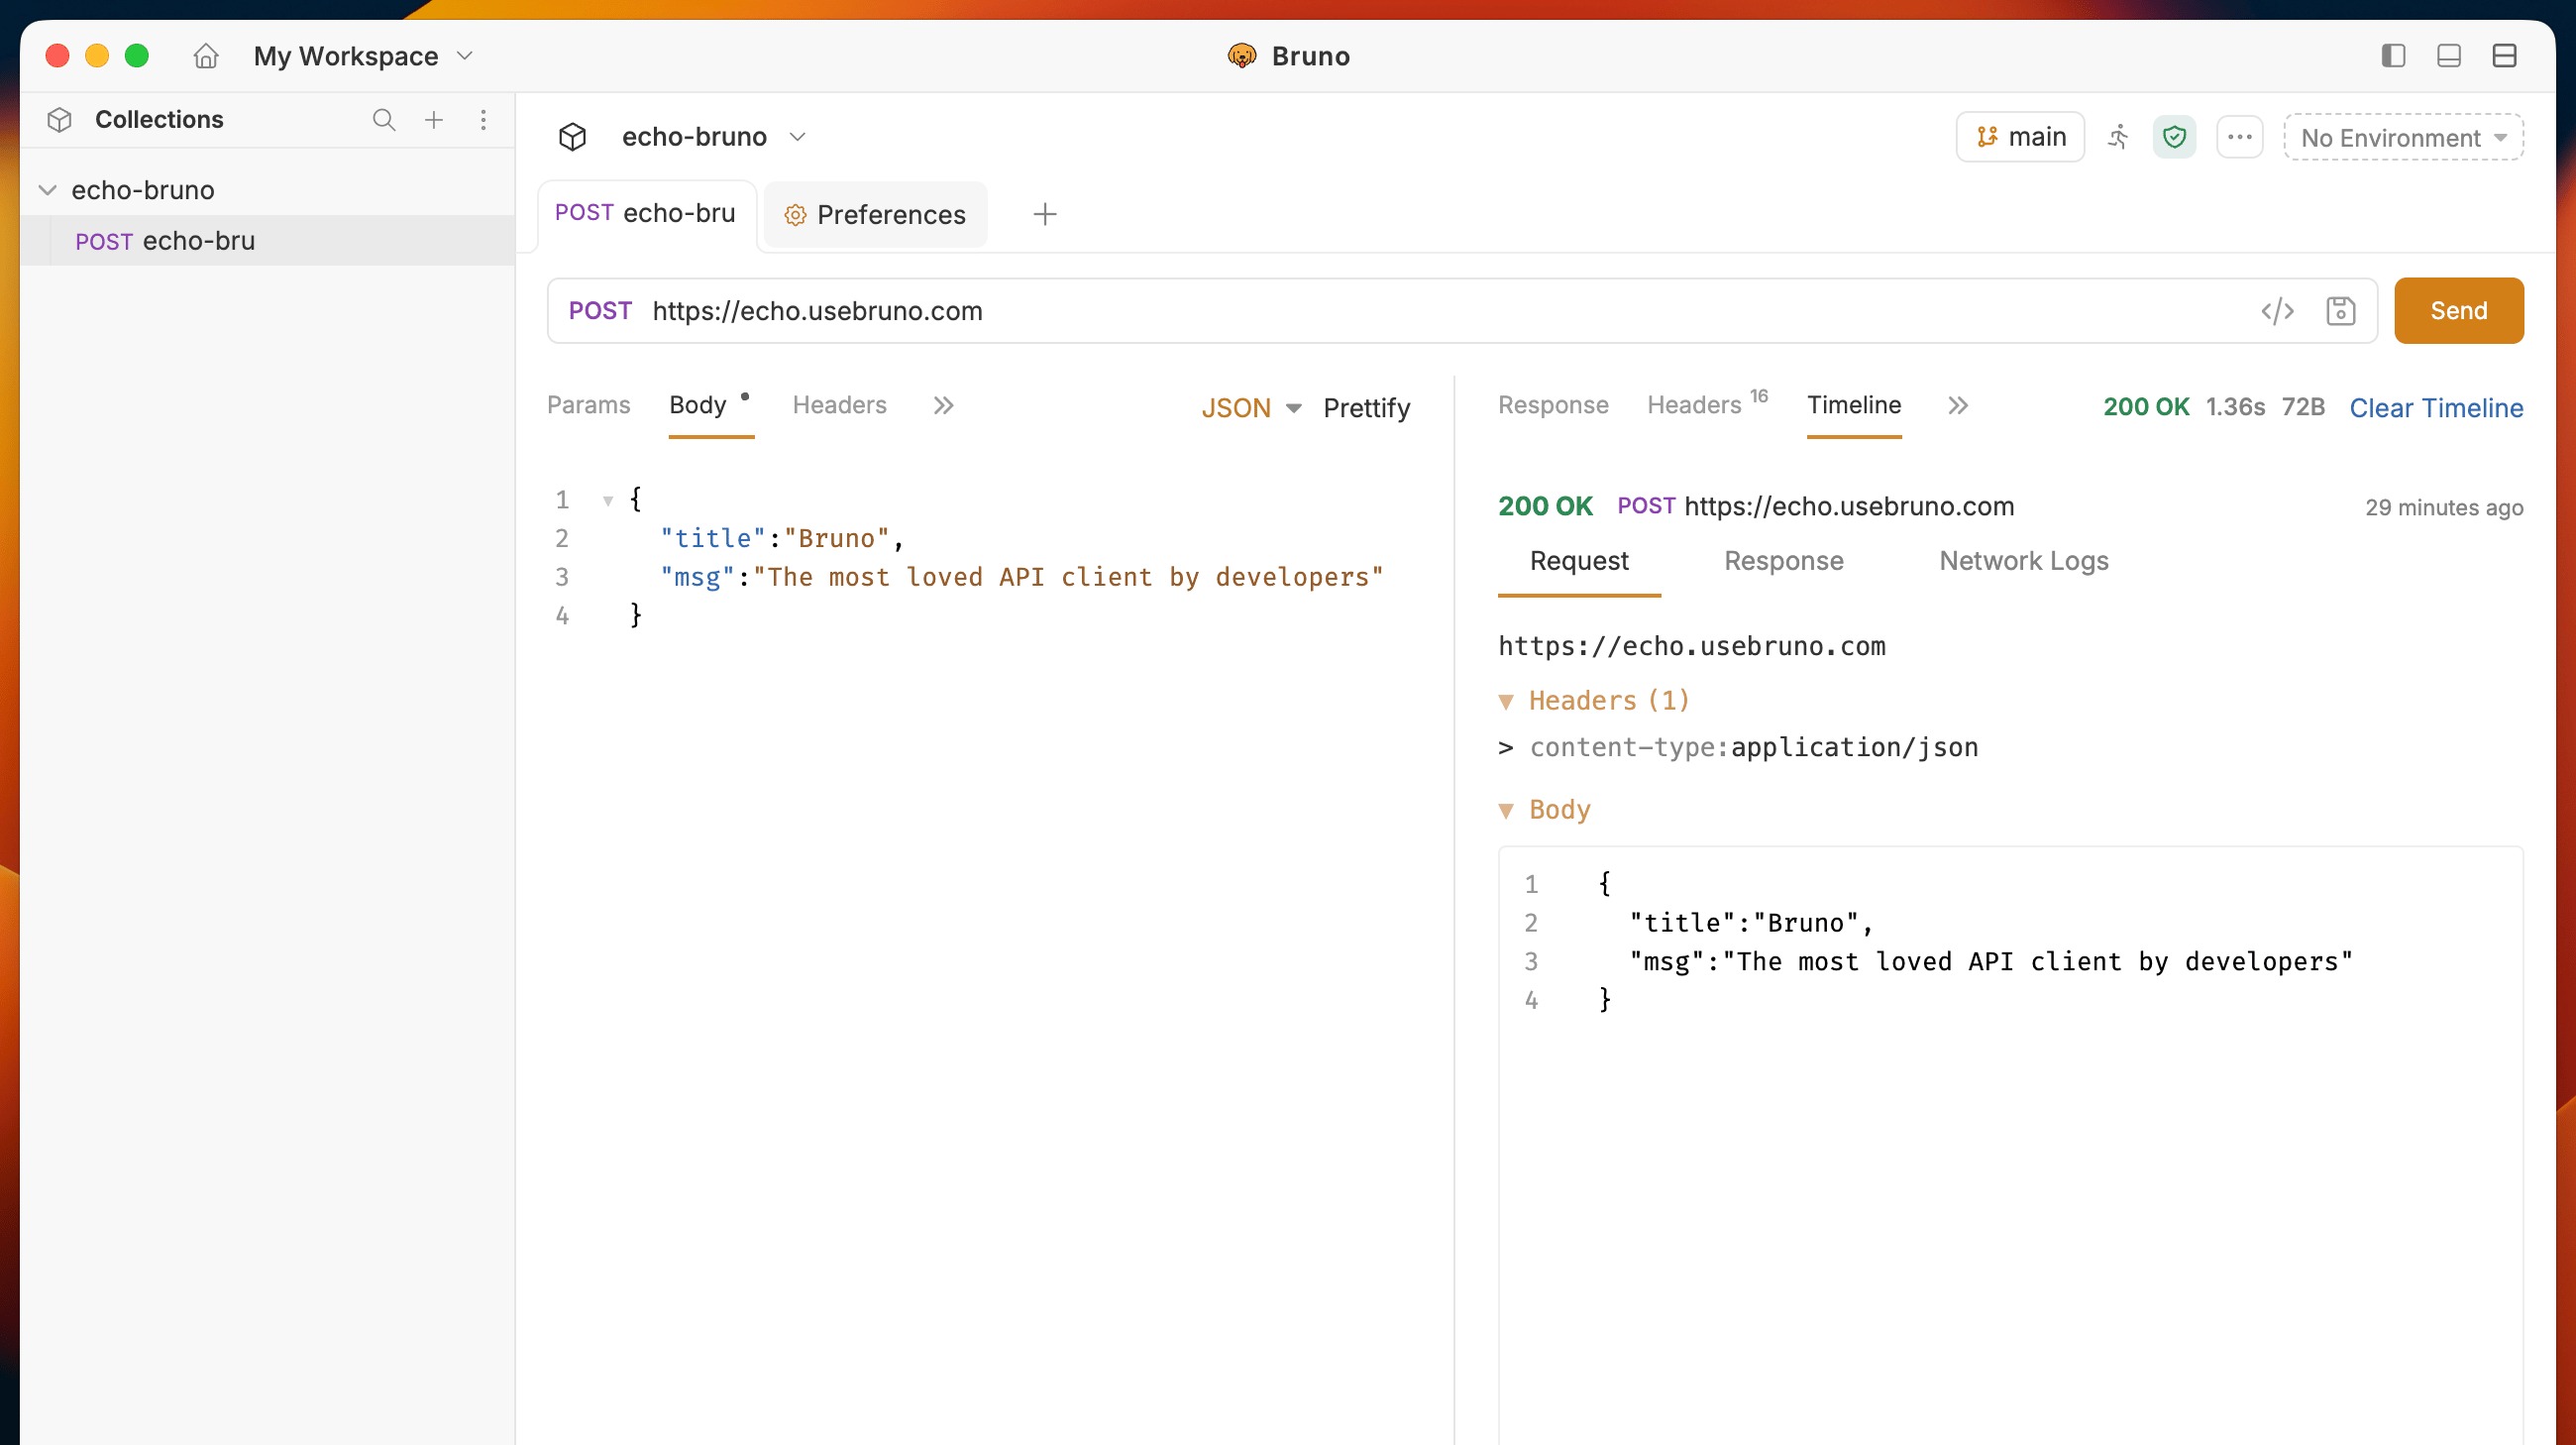
1. Request Tab
The Request tab displays everything that was sent with your API request:- URL - The complete endpoint URL
- Query Parameters - Query strings and path variables
- Request Body - The data payload sent with the request
- Request Headers - All headers included in the request
- Authentication - Authentication details and credentials
- Variables - Variables used in the request
2. Response Tab
The Response tab shows all information received from the server:- Status Code - HTTP status code of the response
- Response Headers - All headers returned by the server
- Response Body - The complete response data
- Response Size - Size of the response payload
- Execution Time - Time taken to complete the request
3. Network Logs Tab
The Network Logs tab provides low-level network insights for advanced debugging:- Request/Response Flow - Detailed timeline of the network transaction
- Network Timing - Breakdown of connection, DNS, SSL, and transfer times
- Protocol Details - HTTP version and connection information
- Debugging Information - Additional network-level diagnostics
Script Logs in Timeline
When scripts usebru.sendRequest() or bru.runRequest(), Timeline lists every HTTP call made during the run. Use the filter tabs to narrow the view.
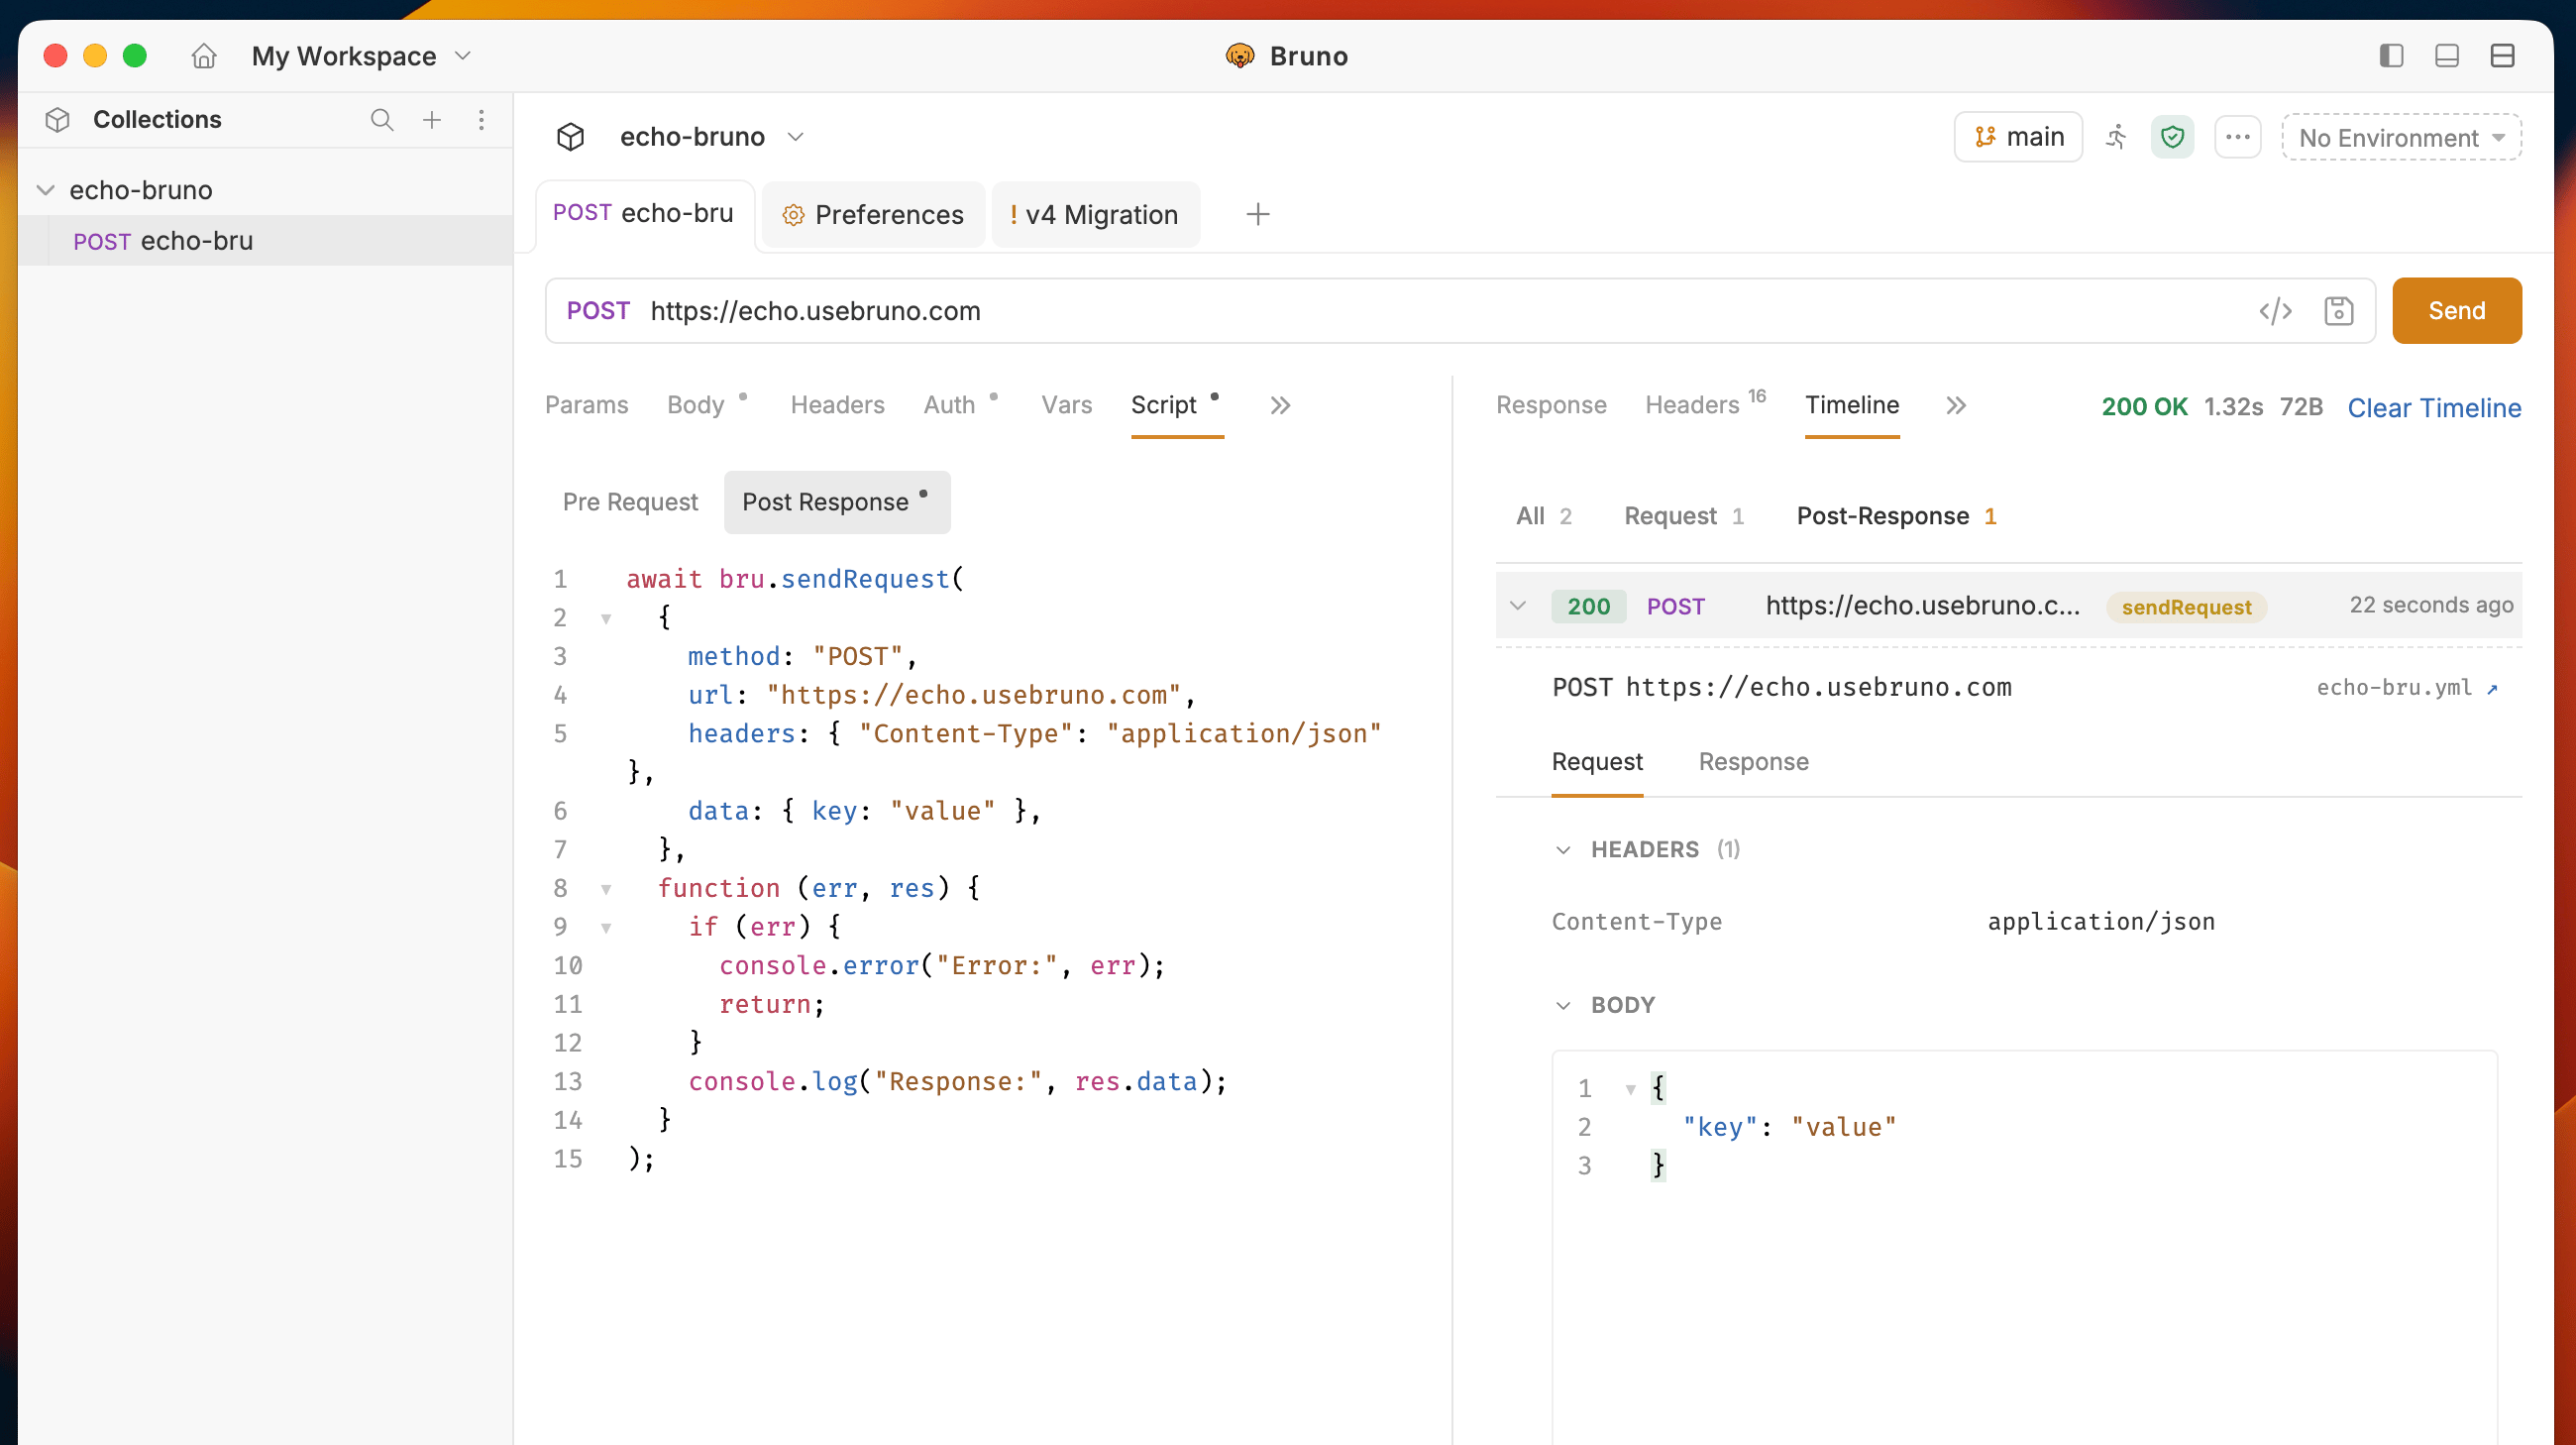
Click a row to expand it and inspect that call’s request body, headers, response, and network timing. Use Clear Timeline to reset the list before the next run.