

bru.visualize function. This feature supports multiple providers and formats to help you analyze and present your API data effectively.
Try it out
Explore the response-visualizer sample collection to see tables, charts, and HTML views in action:Overview
Thebru.visualize function allows you to display API response data in a more readable and interactive format using the bru.visualize function. This feature supports multiple providers and formats to help you analyze and present your API data effectively.
- type(string): The type of visualization to render (e.g., ‘table’, ‘html’).
-
config(object): Depends on
type:table: name, provider (ag-grid,react-table), props.html(raw HTML): name, contenthtml(Handlebars): name, template (Handlebars string), data (object passed into the template), optional options.
Parameters
Config properties
Handlebars is compiled server-side; the Visualize tab receives the rendered HTML.
Supported Visualization
Table Visualization (‘table’)
You can render tables using different providers likeag-grid and react-table.
Syntax:
Using ag-grid
Example: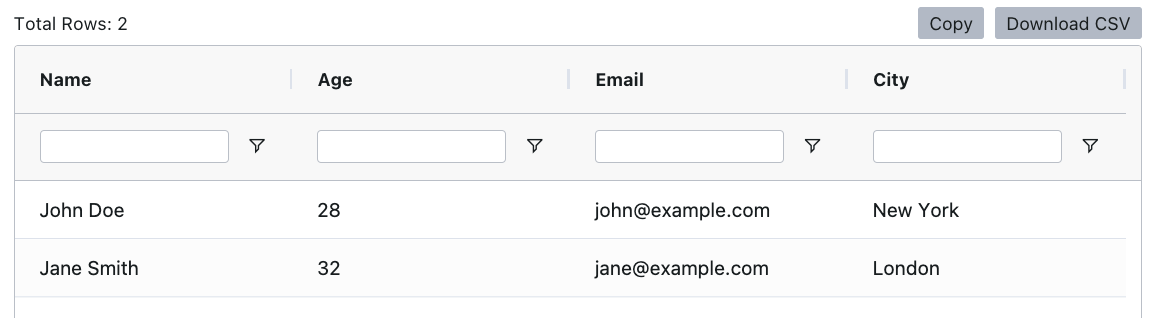
copy
Using react-table
Example: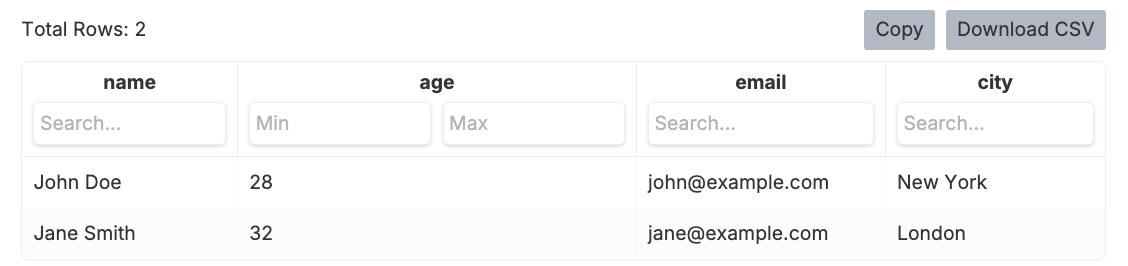
copy
The
header property only accepts string values. Use strings like header: "Column Name".filterVariant: 'text' adds a search box; filterVariant: 'range' adds Min/Max inputs.
HTML visualization ('html')
You can render either raw HTML or a Handlebars template with structured data.
Synatx
Raw HTML (content)
You can pass a full HTML string to the content property to render a raw HTML.
Example:

copy
Handlebars template (template, data, options)
Use Handlebars when you want a small template plus JSON data instead of building HTML strings in script:
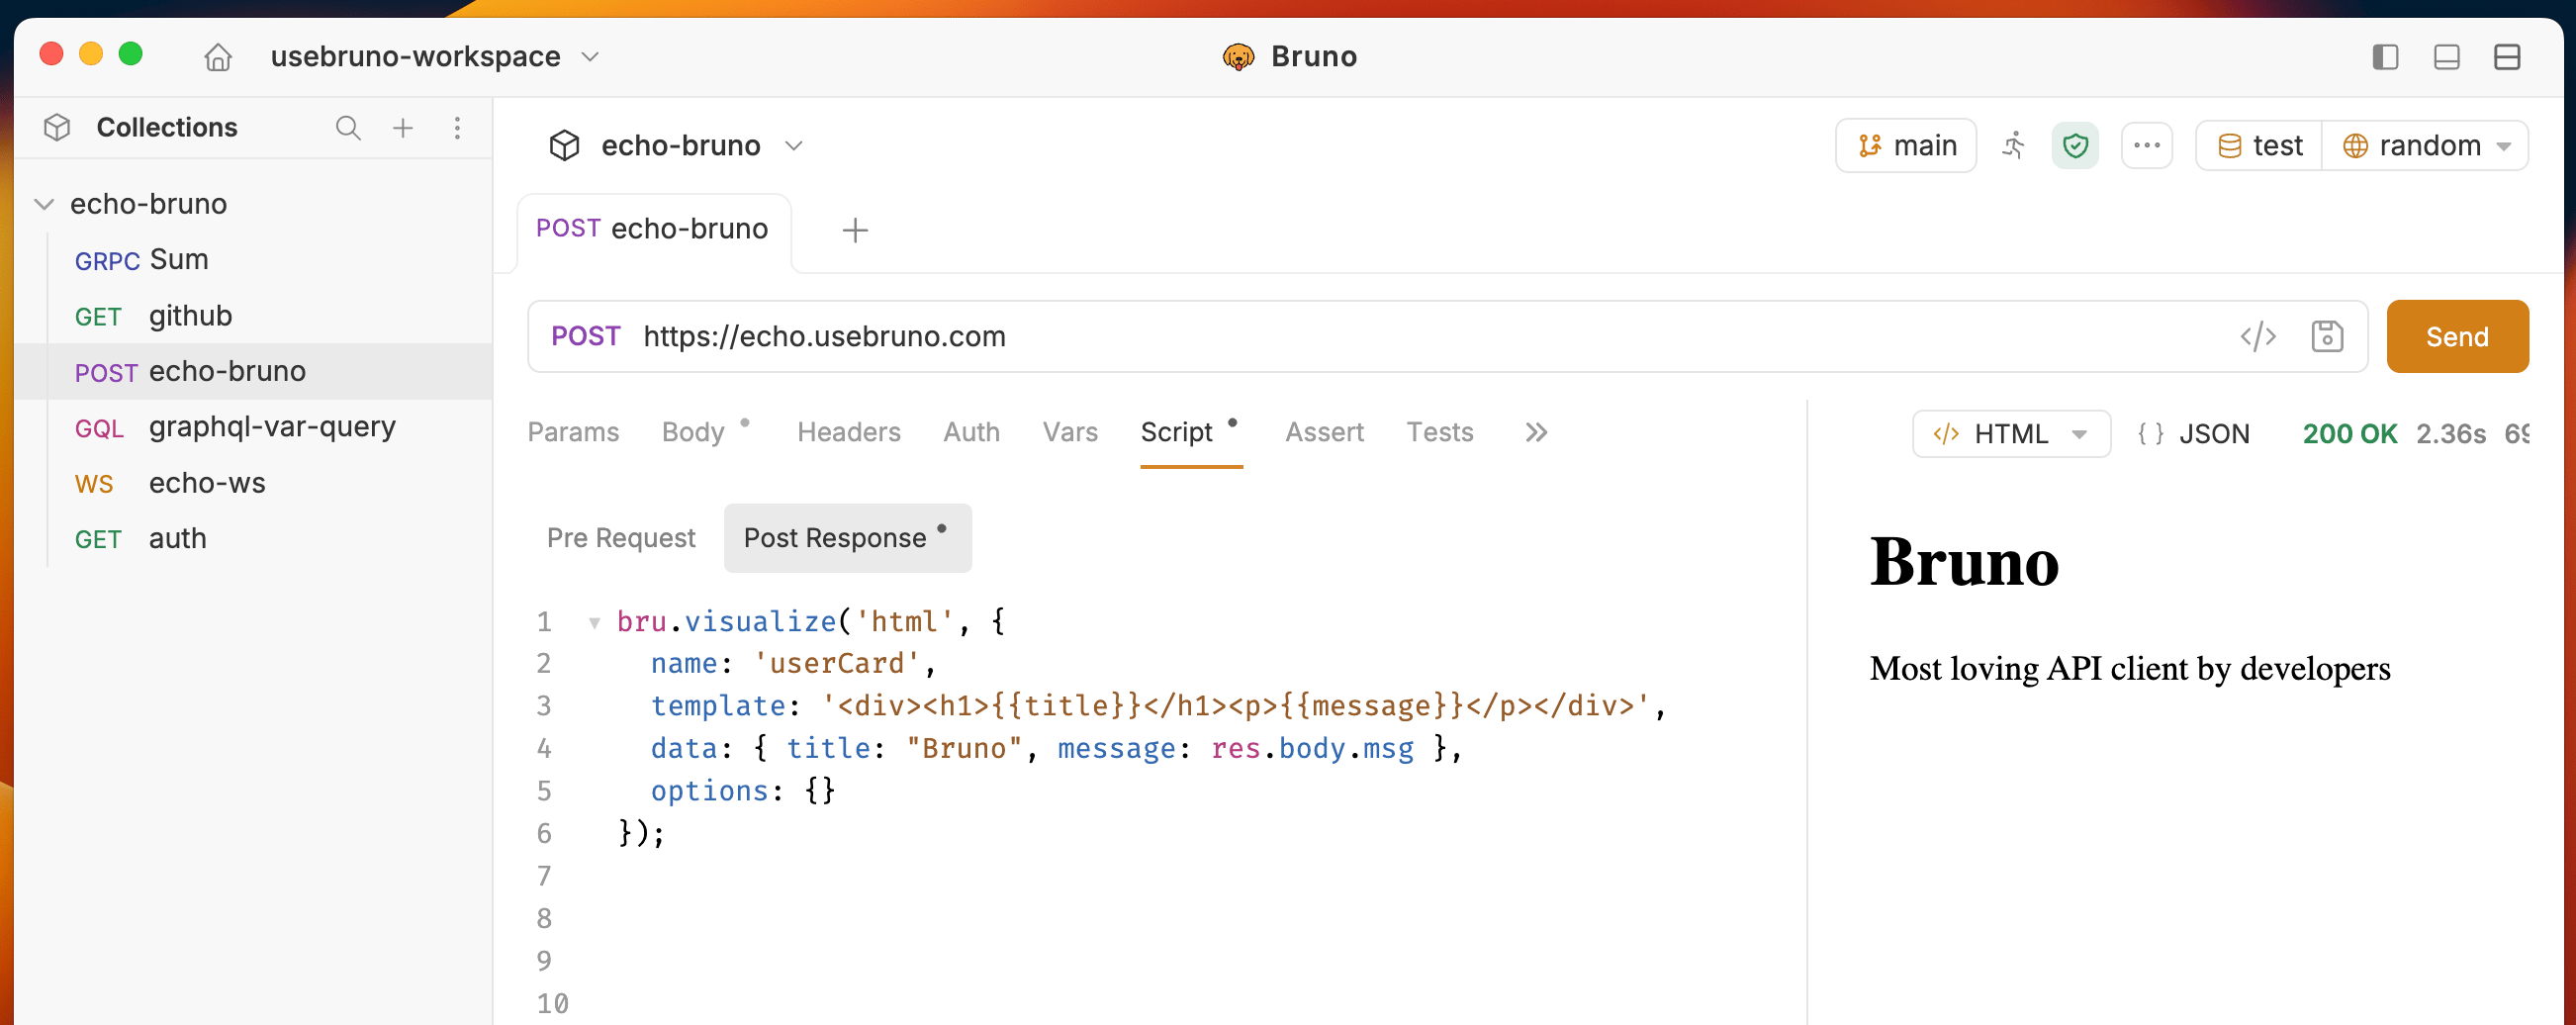
copy
msg property in the response body.
Bruno compiles template with data server-side and renders the result in the Visualize tab.
Handlebars compile options
Theoptions field maps directly to Handlebars.compile() options. Bruno allows a safe subset:
The following options are excluded regardless:
data, compat, knownHelpers, allowProtoPropertiesByDefault, and allowProtoMethodsByDefault — these can alter template resolution in unexpected ways or weaken prototype-traversal protections.
dangerouslyAllowAllOptions
To bypass the allowlist entirely and pass any Handlebars.compile() option, set dangerouslyAllowAllOptions: true inside options:
copy
bru.clearVisualizations()
Clears every visualization registered for the current request and resets the internal list (same idea as Postman’s pm.visualizer.clear()).
copy
Postman pm.visualizer mapping
When you import a Postman collection, script calls are translated automatically:
Read more from Postman migration and Converters overview.
Examples
One of the most powerful features ofbru.visualize is the ability to transform API responses into visual tables. Here are practical examples of working with real API data:
Custom Dashboard with Statistics
Create rich dashboards with API data:- Create or use existing request.
- Go to request -> Script (post-response) tab and add the following code:
- Click on Send button to execute the request.
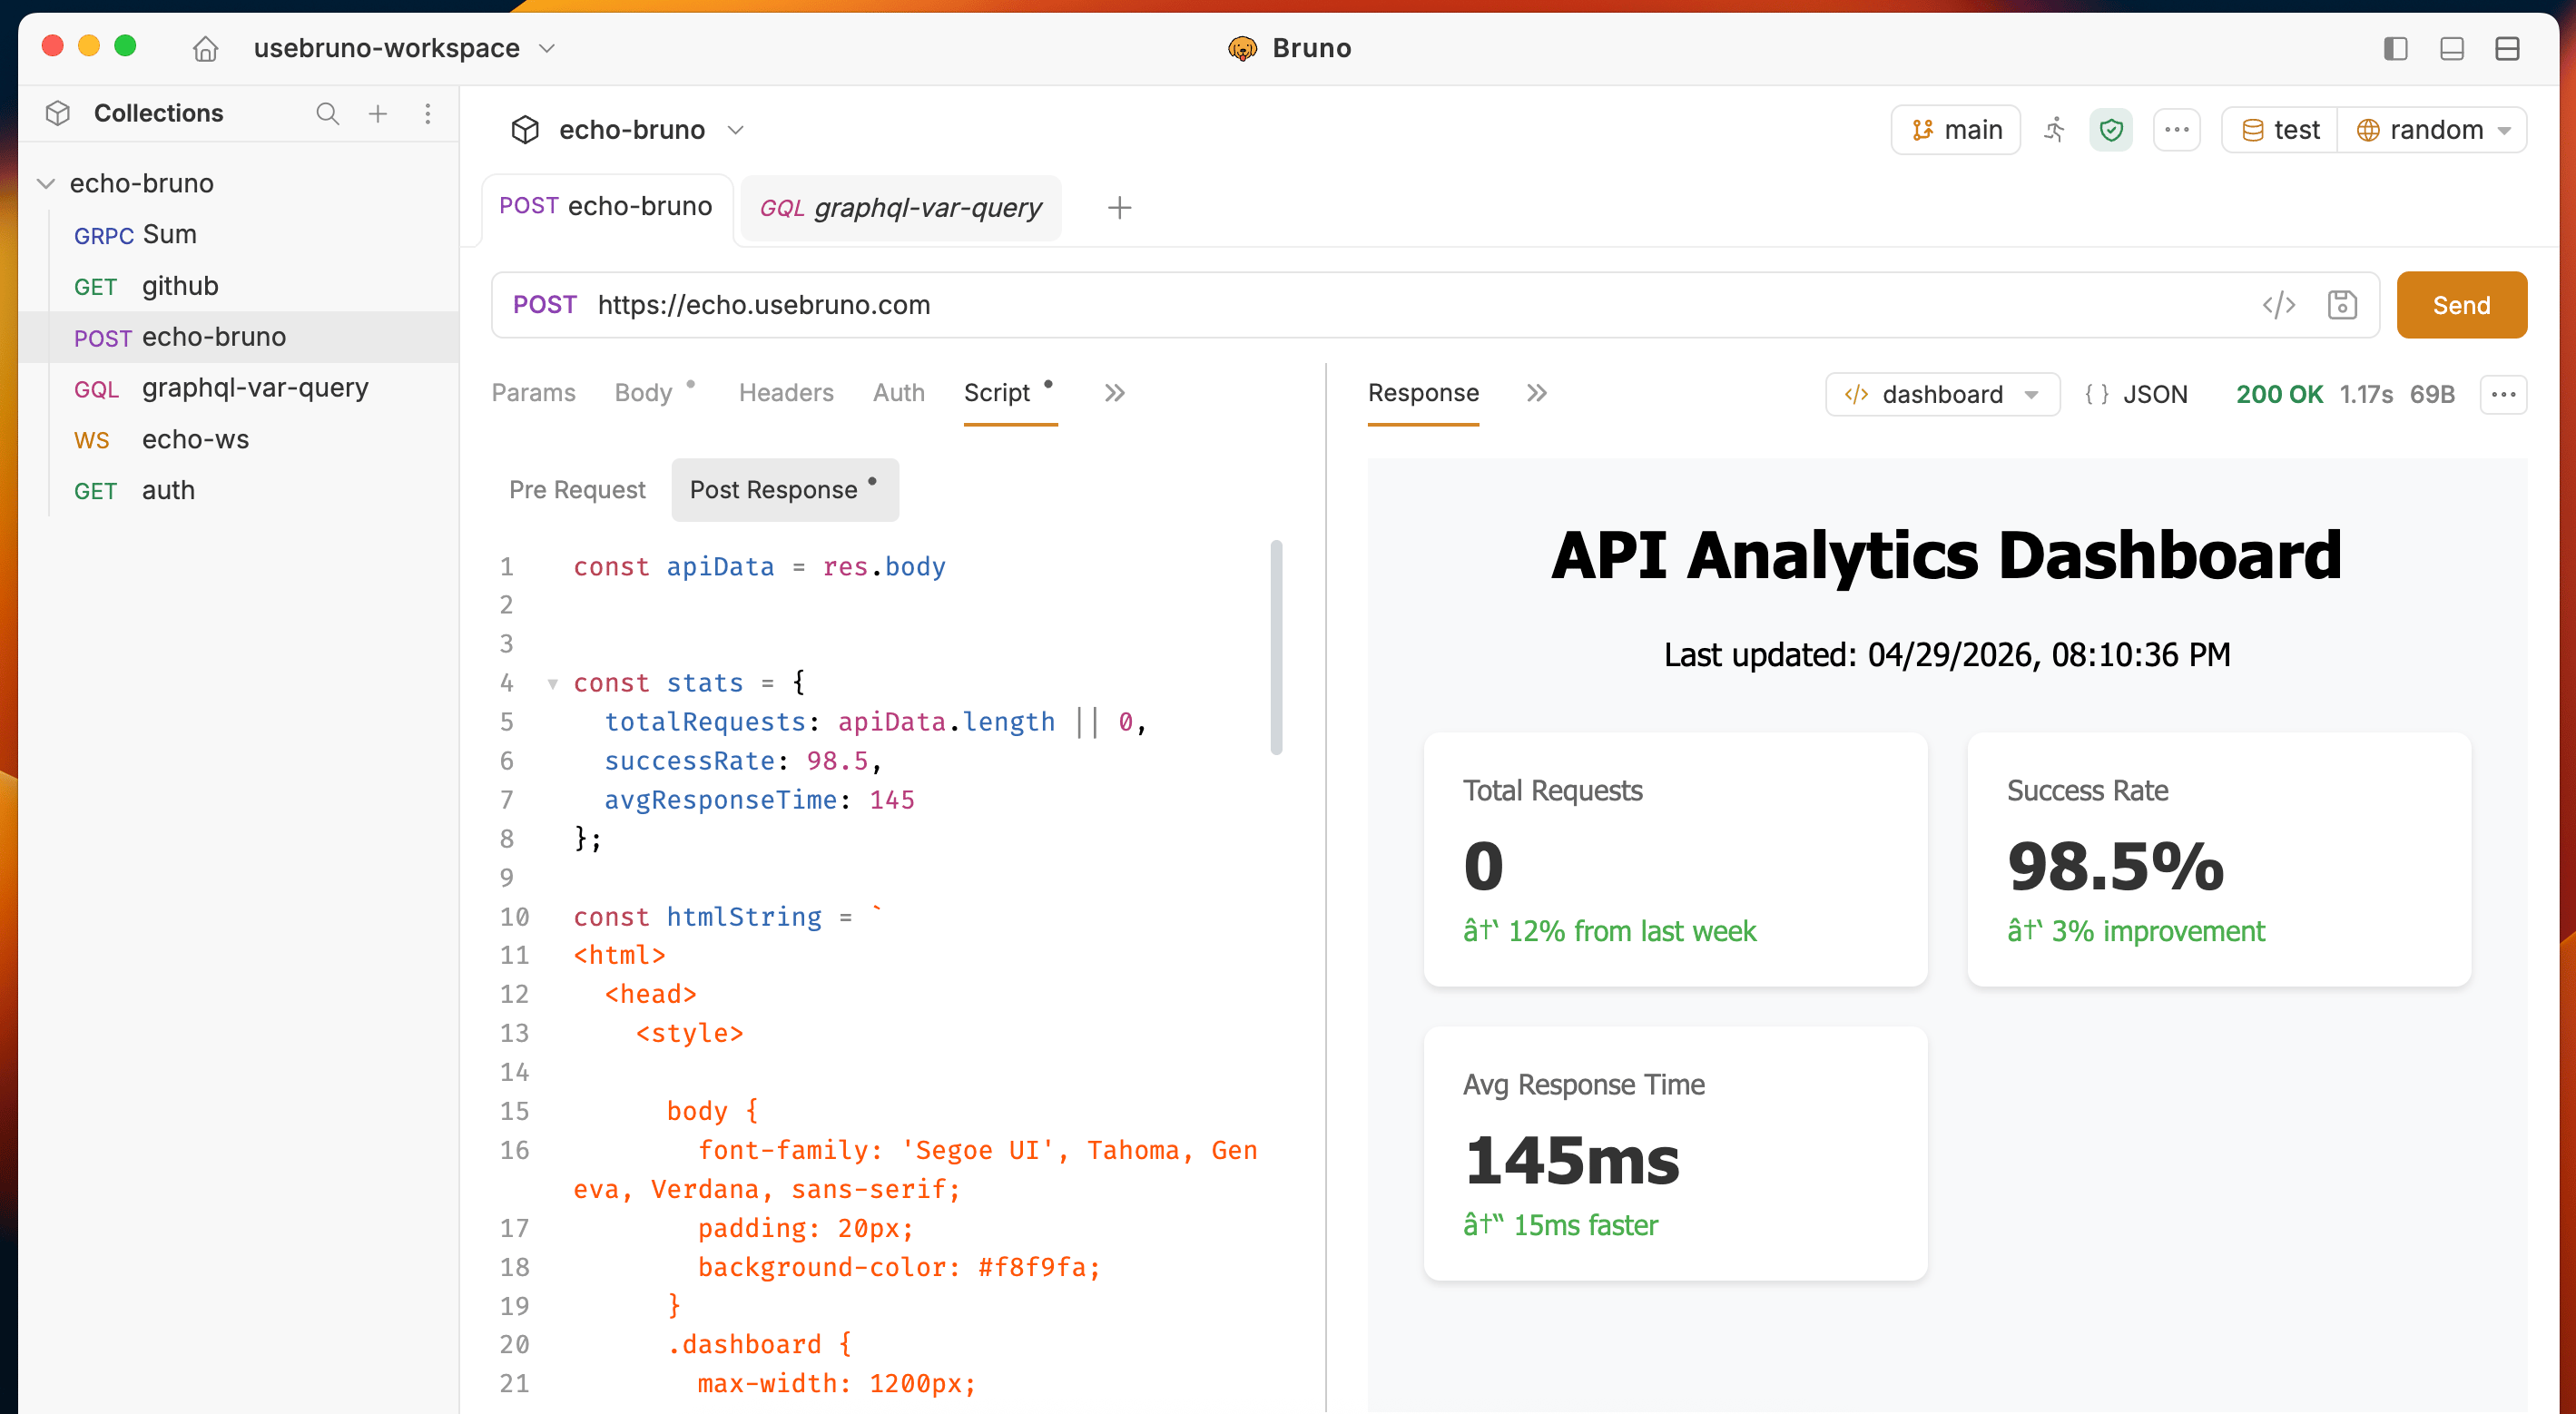
copy
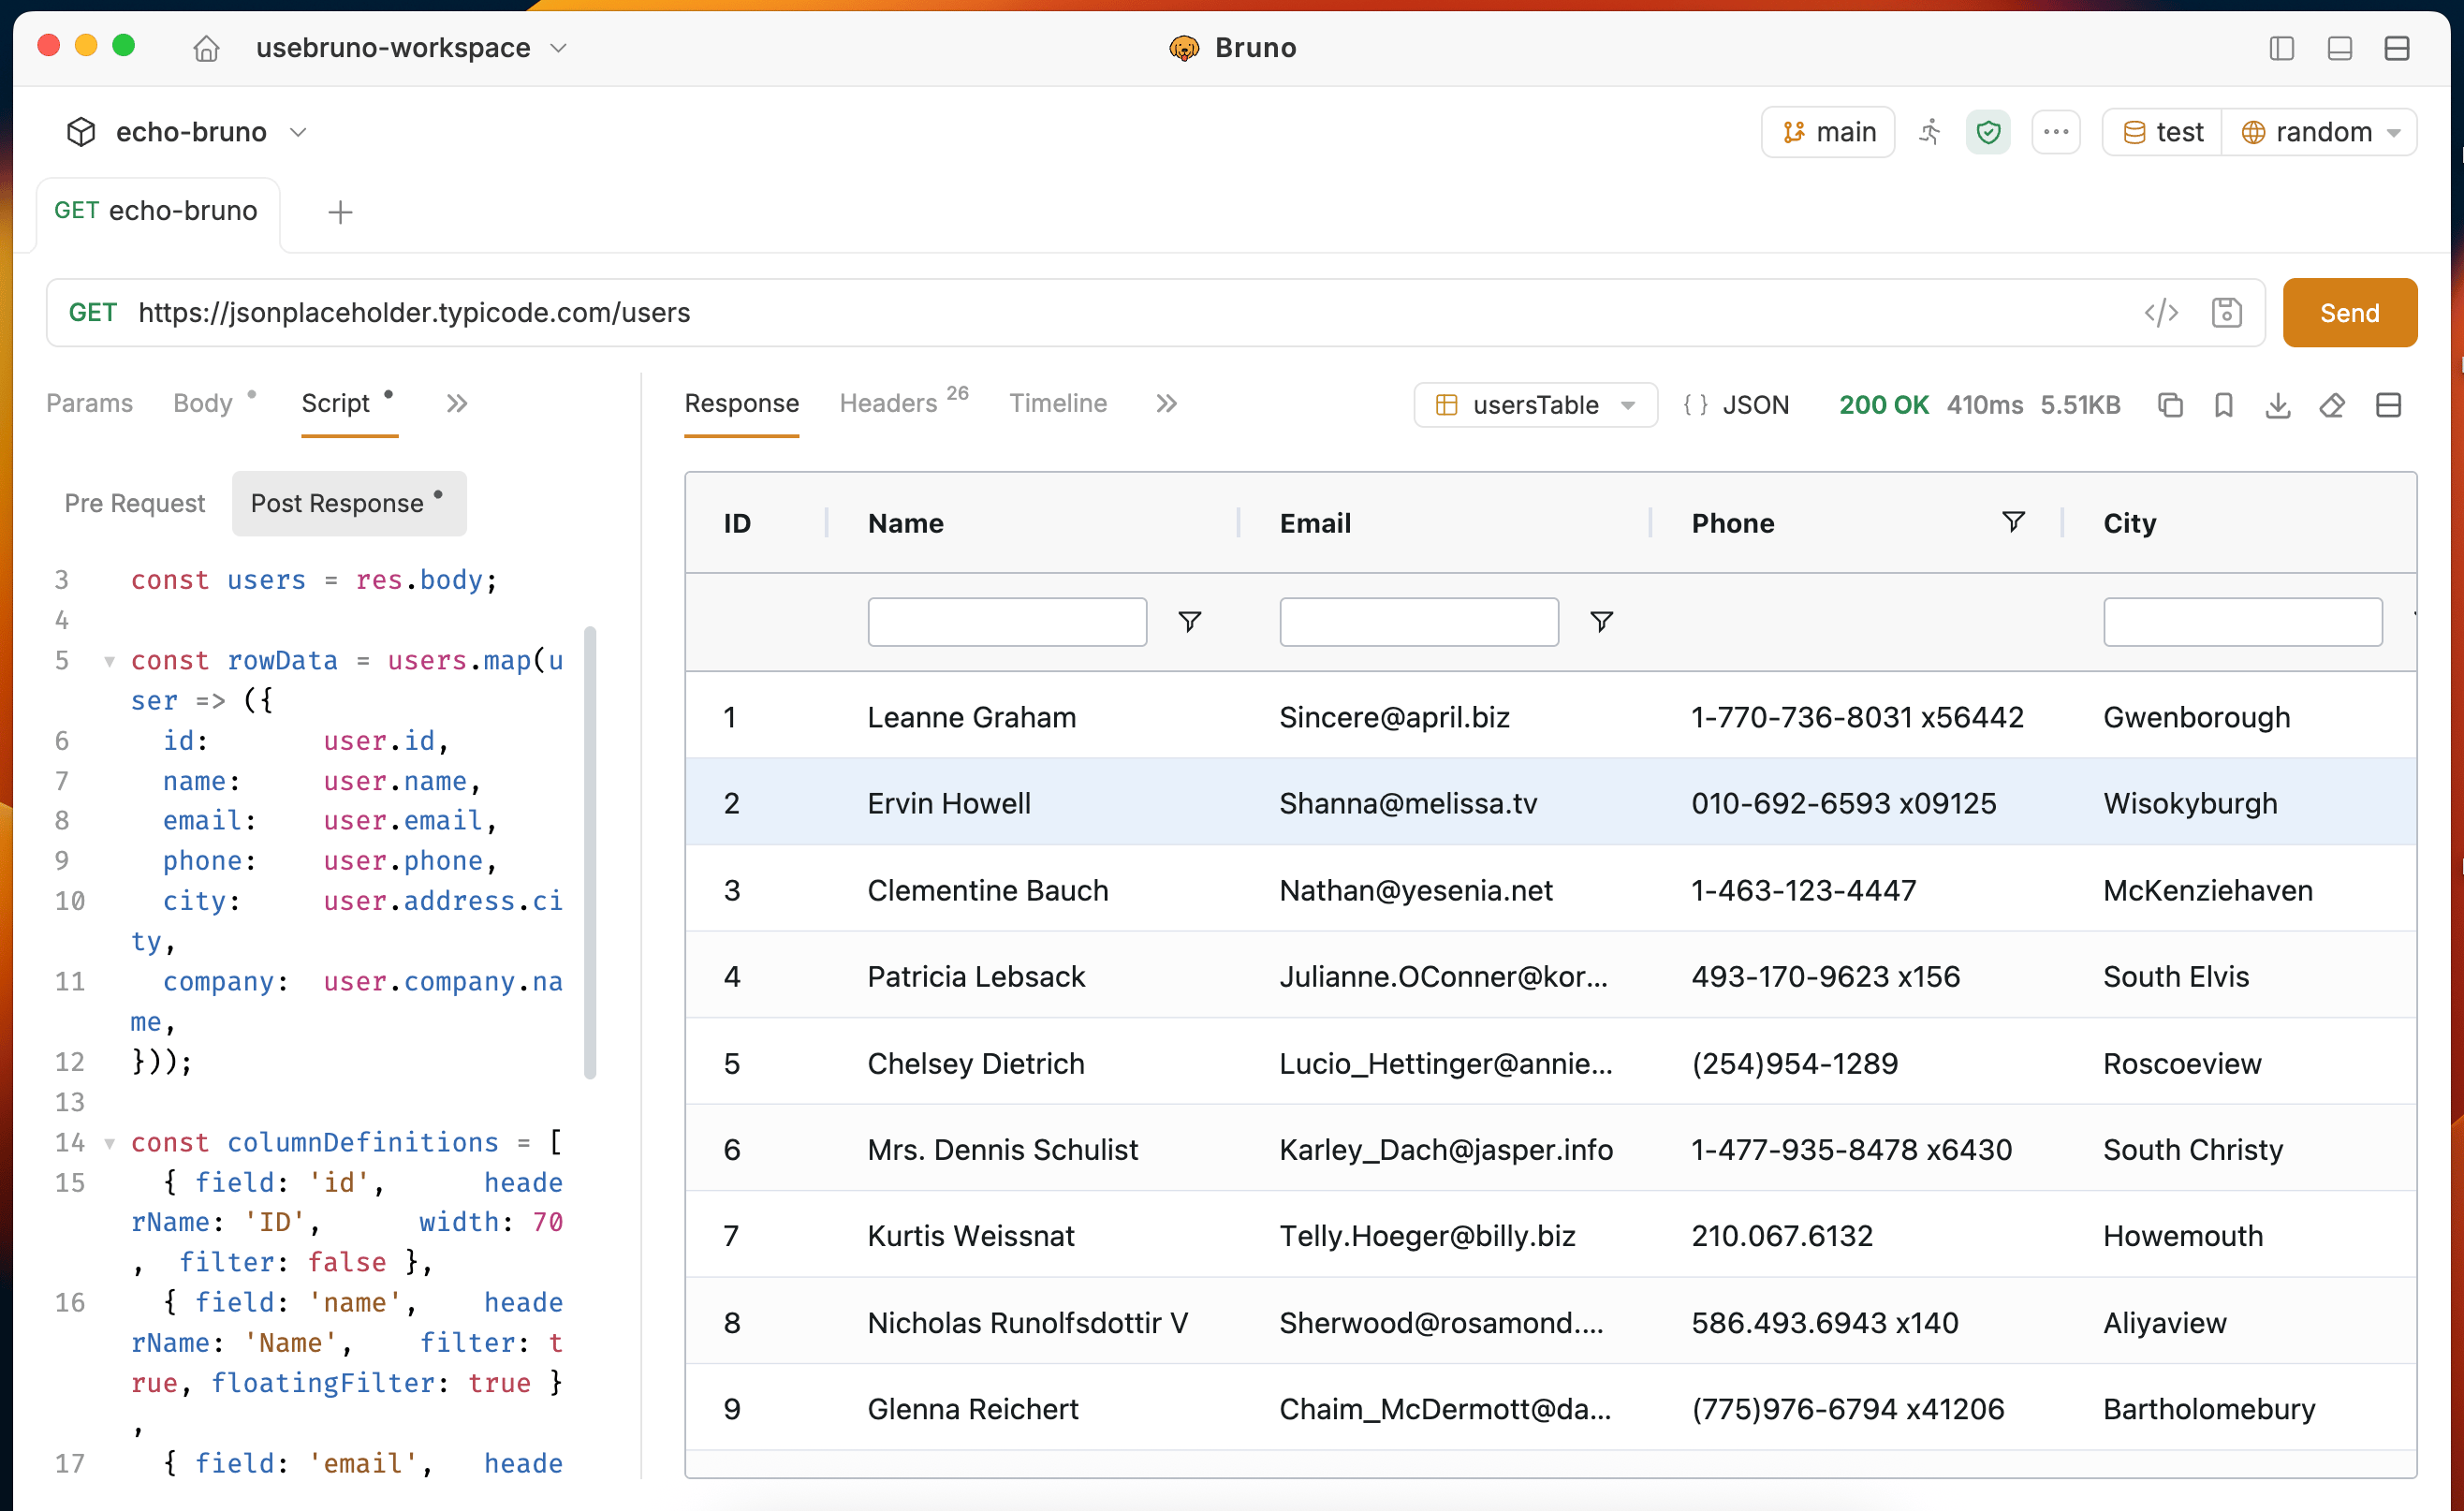
Using API Response Data with Table
Render a live API response directly as an interactive table with sorting and filtering usingag-grid.
copy
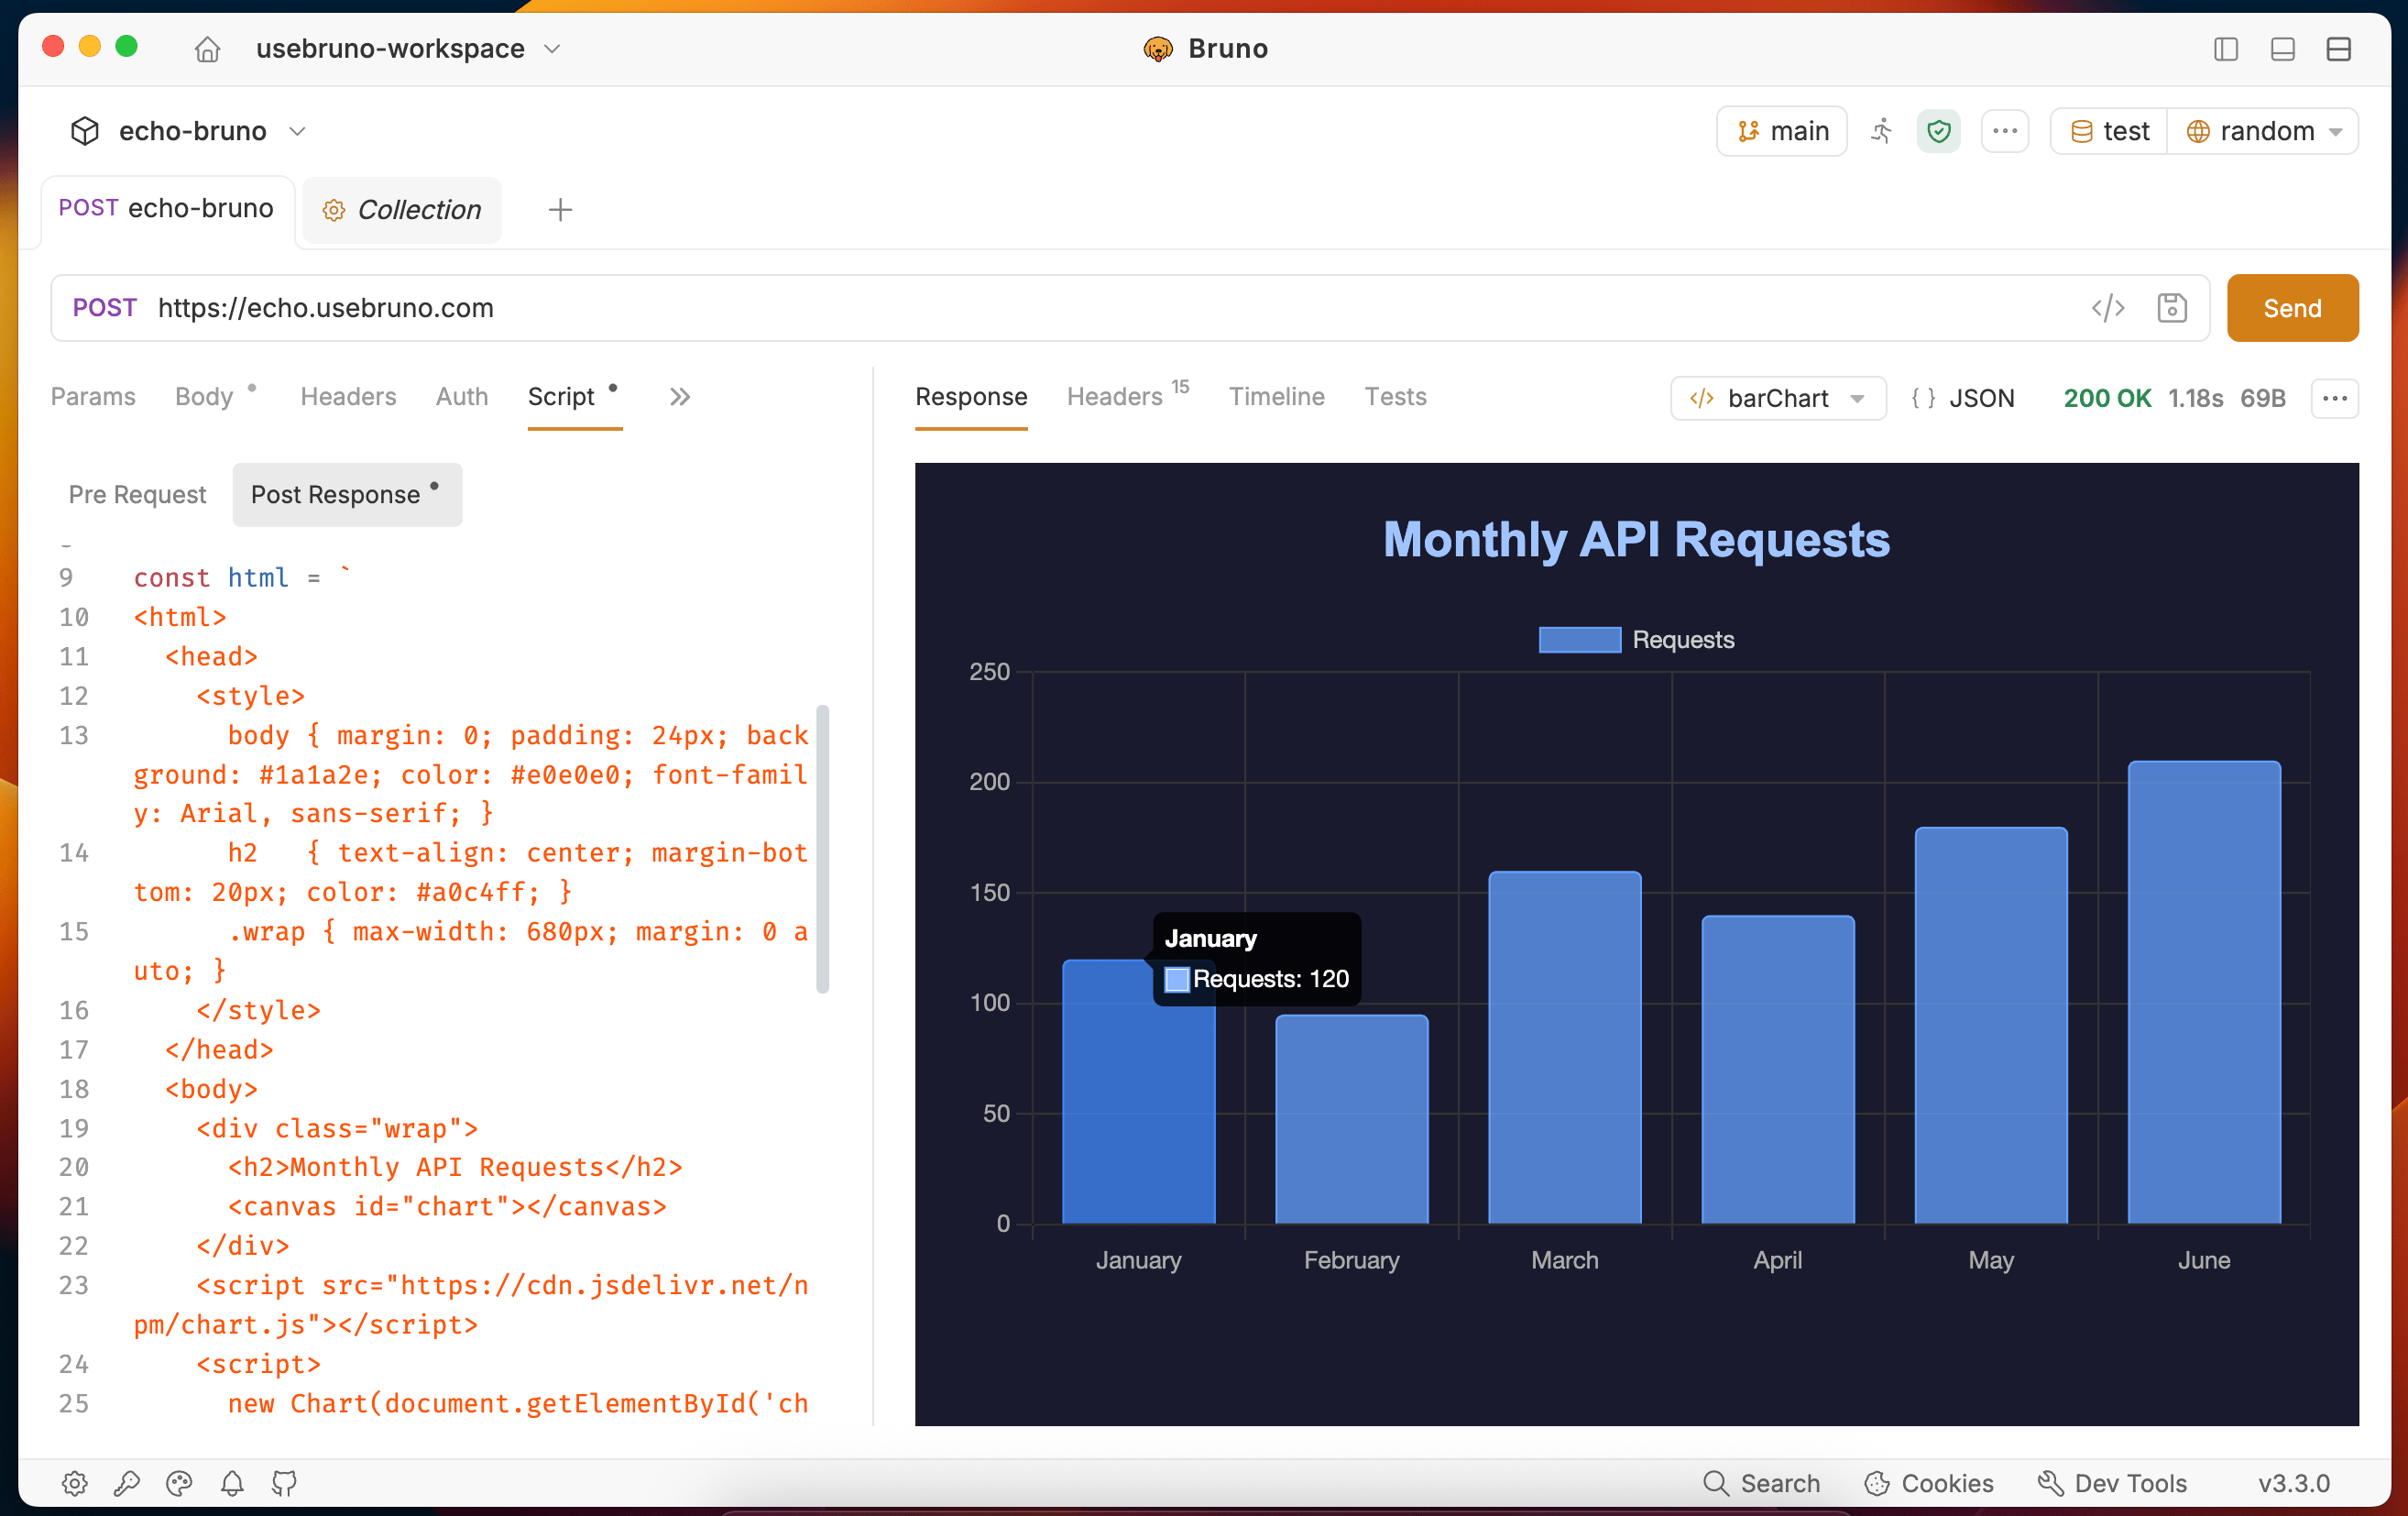
Bar Chart
Render a bar chart using Chart.js loaded via CDN. Uses static data by default — swap inres.body values for live API data.
copy
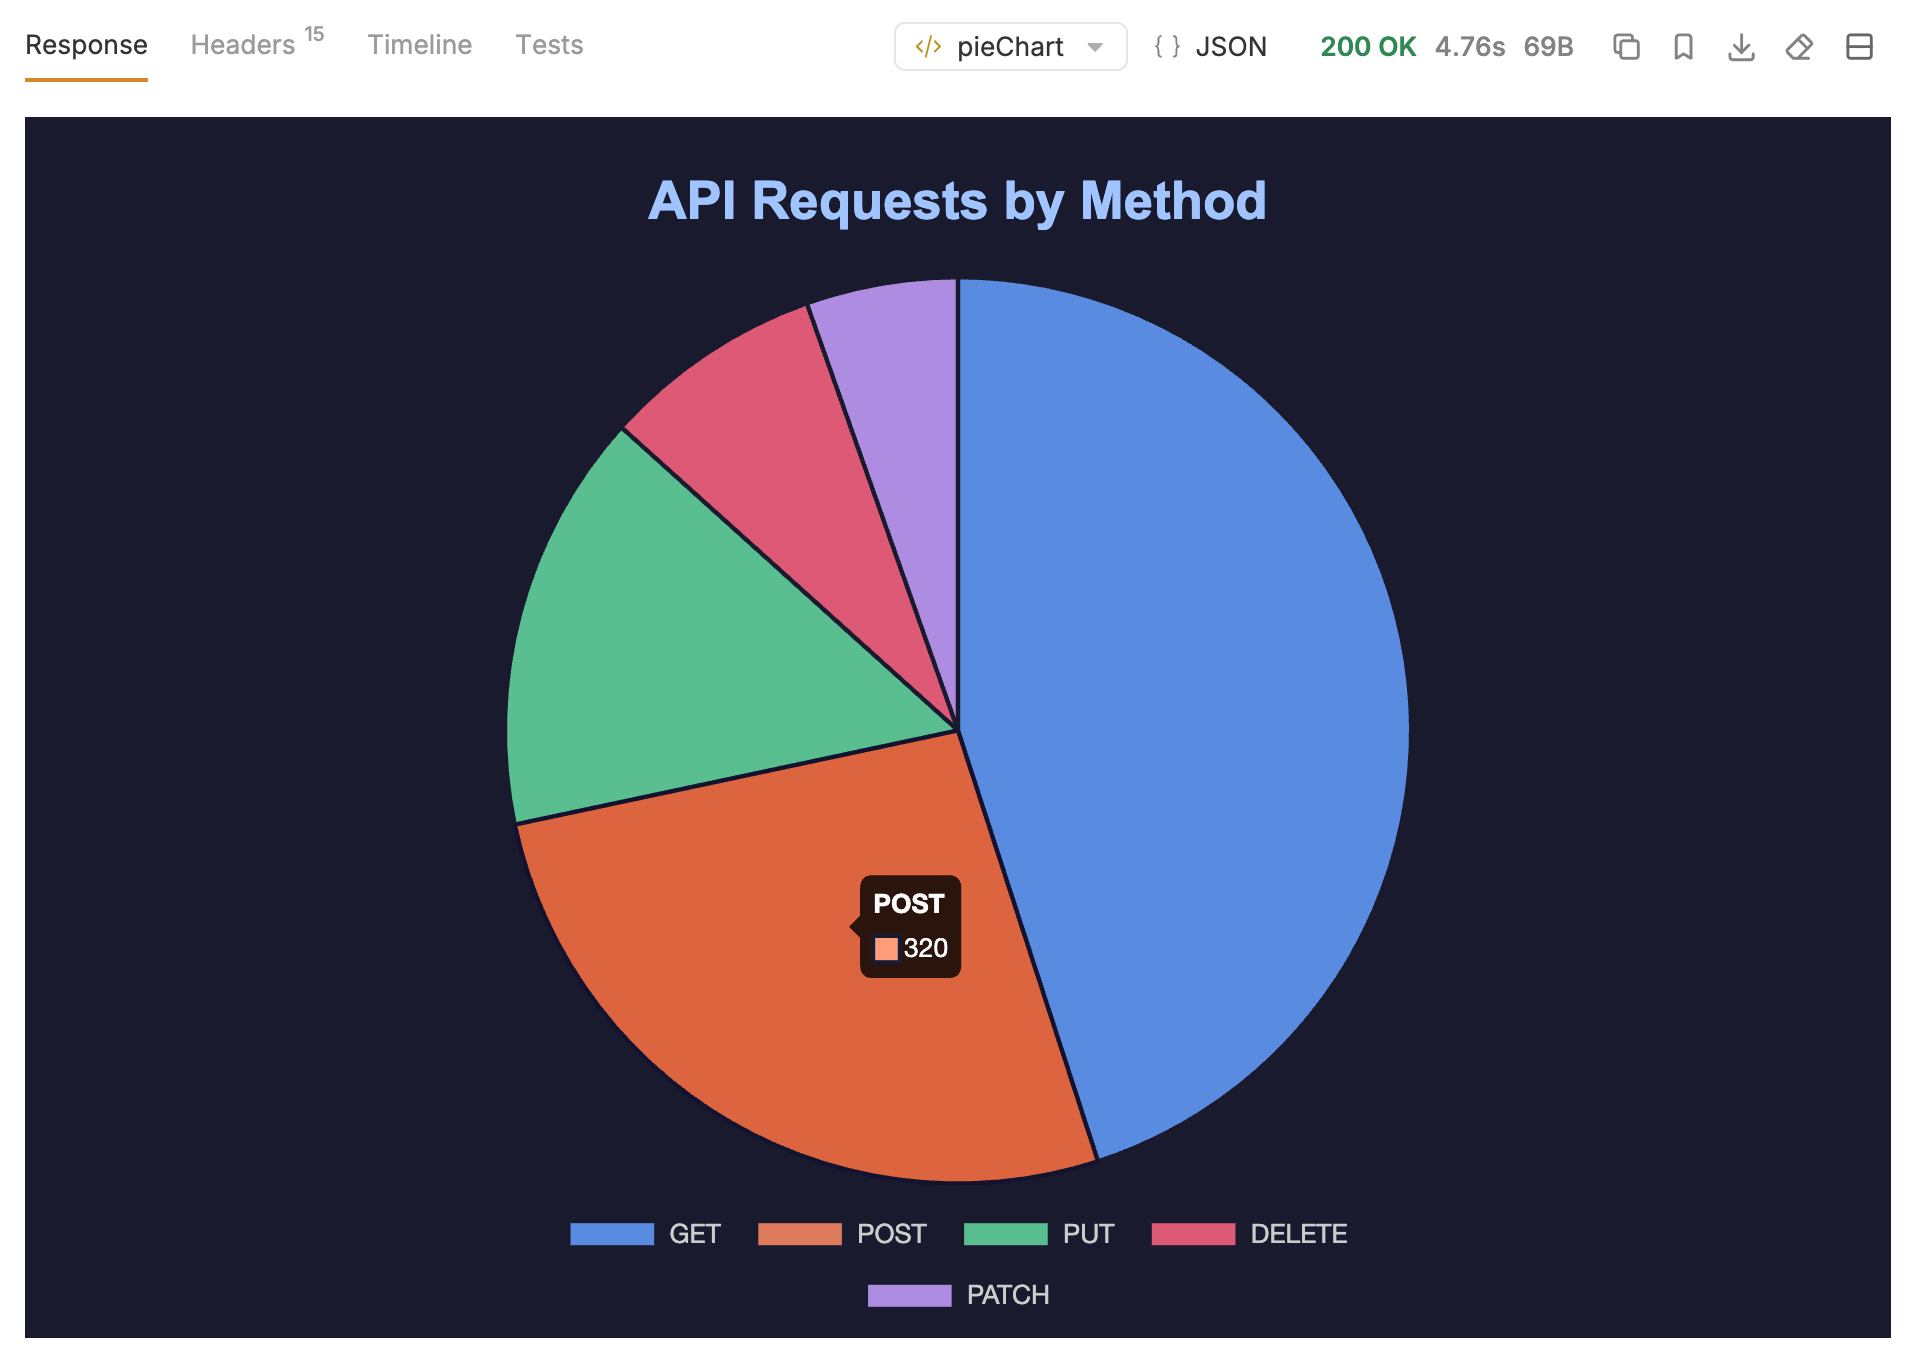
Pie Chart
Render a pie chart using Chart.js via CDN. Uses static data by default — swap inres.body values for live API data.
copy