> ## Documentation Index
> Fetch the complete documentation index at: https://docs.usebruno.com/llms.txt
> Use this file to discover all available pages before exploring further.
# Response Visualization
export const BrunoButton = ({collectionUrl, width = 160, height = 40, className = '', style = {}}) => {
const encodedUrl = encodeURIComponent(collectionUrl);
const buttonUrl = `https://fetch.usebruno.com?url=${encodedUrl}`;
return

;
};
Bruno provides a powerful visualization feature that allows you to display API response data in a more readable and interactive format using the `bru.visualize` function. This feature supports multiple providers and formats to help you analyze and present your API data effectively.
## Try it out
Explore the [response-visualizer](https://github.com/bruno-collections/response-visualizer) sample collection to see tables, charts, and HTML views in action:
## Overview
The `bru.visualize` function allows you to display API response data in a more readable and interactive format using the `bru.visualize` function. This feature supports multiple providers and formats to help you analyze and present your API data effectively.
```javascript theme={null}
bru.visualize(type, config)
```
1. **type**(string): The type of visualization to render (e.g., 'table', 'html').
2. **config**(object): Depends on `type`:
* **`table`**: **name**, **provider** (`ag-grid`, `react-table`), **props**.
* **`html` (raw HTML)**: **name**, **content**
* **`html` (Handlebars)**: **name**, **template** (Handlebars string), **data** (object passed into the template), optional **options**.
### Parameters
| Name | Type | Description |
| -------- | -------- | -------------------------------------------------------------------- |
| `type` | `string` | Visualization kind: `'table'` or `'html'`. |
| `config` | `object` | See **Config properties** below. Table vs HTML use different fields. |
### Config properties
| Property | Type | Used with | Description |
| ---------- | -------- | ----------------------------- | -------------------------------------------------------------------------------- |
| `name` | `string` | `table`, `html` | Instance label in the Visualize tab. |
| `provider` | `string` | `table` only | `ag-grid` or `react-table`. |
| `props` | `object` | `table` only | Provider-specific row/column config. |
| `content` | `string` | `html` (raw) | Full HTML string (safe mode OK). |
| `template` | `string` | `html` (Handlebars) | Handlebars source (not in QuickJS safe mode). |
| `data` | `object` | `html` (Handlebars) | Template context object — values are available as `{{key}}` inside the template. |
| `options` | `object` | `html` (Handlebars, optional) | `Handlebars.compile()` options. Accepts a safe subset of options (see below). |
Handlebars is compiled server-side; the Visualize tab receives the rendered HTML.
## Supported Visualization
### Table Visualization ('table')
You can render tables using different providers like `ag-grid` and `react-table`.
**Syntax**:
```js theme={null}
bru.visualize('table', { // type
// config
name: '', // name of the visualization
provider: '', // provider type (ag-grid, react-table)
props: { , } // provider-specific row/column config
});
```
#### Using **ag-grid**
*Example:*
 ```javascript copy theme={null}
const rowData = [
{ name: 'John Doe', age: 28, email: 'john@example.com', city: 'New York' },
{ name: 'Jane Smith', age: 32, email: 'jane@example.com', city: 'London' }
];
const columnDefinitions = [
{ field: "name", filter: true, floatingFilter: true },
{ field: "age", filter: true, floatingFilter: true },
{ field: "email", filter: true, floatingFilter: true },
{ field: "city", filter: true, floatingFilter: true }
];
bru.visualize('table', {
name: 'table1',
provider: 'ag-grid',
props: { rowData, columnDefinitions }
});
```
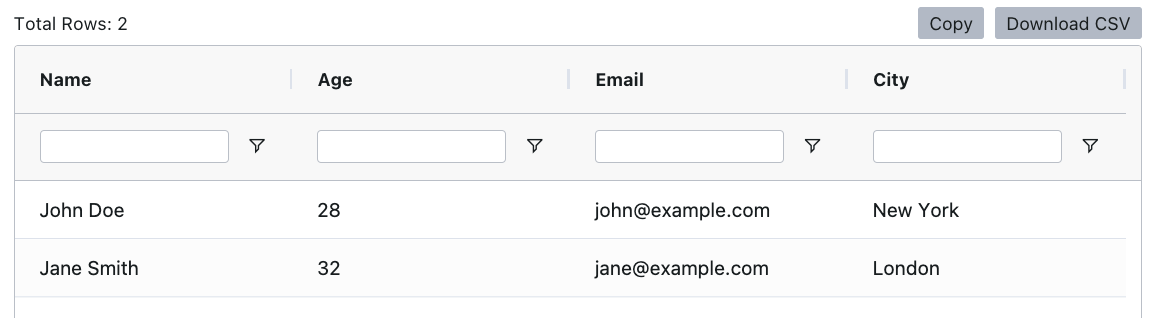
This will render a table using the ag-grid provider with filters enabled on all columns.
#### Using **react-table**
*Example:*
```javascript copy theme={null}
const rowData = [
{ name: 'John Doe', age: 28, email: 'john@example.com', city: 'New York' },
{ name: 'Jane Smith', age: 32, email: 'jane@example.com', city: 'London' }
];
const columnDefinitions = [
{ field: "name", filter: true, floatingFilter: true },
{ field: "age", filter: true, floatingFilter: true },
{ field: "email", filter: true, floatingFilter: true },
{ field: "city", filter: true, floatingFilter: true }
];
bru.visualize('table', {
name: 'table1',
provider: 'ag-grid',
props: { rowData, columnDefinitions }
});
```
This will render a table using the ag-grid provider with filters enabled on all columns.
#### Using **react-table**
*Example:*
 ```javascript copy theme={null}
const rowData = [
{ name: 'John Doe', age: 28, email: 'john@example.com', city: 'New York' },
{ name: 'Jane Smith', age: 32, email: 'jane@example.com', city: 'London' },
];
const columnDefinitions = [
{ id: 'name', header: 'name', cell: (info) => info.getValue(), meta: { filterVariant: 'text' } },
{ id: 'age', header: 'age', cell: (info) => info.getValue(), meta: { filterVariant: 'range' } },
{ id: 'email', header: 'email', cell: (info) => info.getValue(), meta: { filterVariant: 'text' } },
{ id: 'city', header: 'city', cell: (info) => info.getValue(), meta: { filterVariant: 'text' } },
];
bru.visualize('table', {
name: 'table2',
provider: 'react-table',
props: { rowData, columnDefinitions }
});
```
The `header` property only accepts **string values**. Use strings like `header: "Column Name"`.
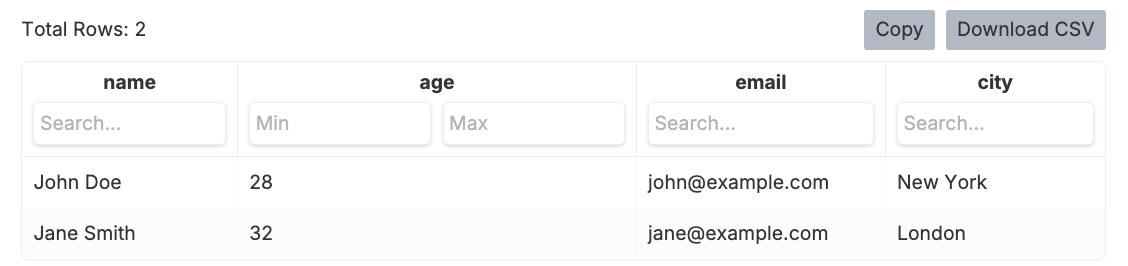
This renders a table with text and range filters. `filterVariant: 'text'` adds a search box; `filterVariant: 'range'` adds Min/Max inputs.
### HTML visualization (`'html'`)
You can render either **raw HTML** or a **Handlebars** template with structured **data**.
**Synatx**
```js theme={null}
bru.visualize('html', { // type
name: '', // name of the visualization
content: `<raw-html>` // or <template>, <data>, <options> (handlebars)
});
```
#### Raw HTML (`content`)
You can pass a full HTML string to the `content` property to render a raw HTML.
*Example:*
<img src="https://mintcdn.com/bruno-a6972042/QYCaSeVC3onHpqpv/images/screenshots/visualization/html.webp?fit=max&auto=format&n=QYCaSeVC3onHpqpv&q=85&s=f1a715f5a5e261d340bdbd11b193ccfd" alt="html" width="1152" height="200" data-path="images/screenshots/visualization/html.webp" />
```javascript copy theme={null}
const htmlString = `
<html>
<head>
<style>
table { width: 100%; border-collapse: collapse; }
th, td { border: 1px solid #888888; padding: 8px; color: #cccccc; }
th { background-color: #555555; color: #ffffff; }
</style>
</head>
<body>
<table>
<tr><th>Name</th><th>Age</th><th>Email</th><th>City</th></tr>
<tr><td>John Doe</td><td>28</td><td>john@example.com</td><td>New York</td></tr>
<tr><td>Jane Smith</td><td>32</td><td>jane@example.com</td><td>London</td></tr>
</table>
</body>
</html>
`;
bru.visualize('html', {
name: 'htmlReport',
content: htmlString
});
```
This example will render an HTML table with predefined data using the html type.
#### Handlebars template (`template`, `data`, `options`)
Use Handlebars when you want a small template plus JSON data instead of building HTML strings in script:
<img src="https://mintcdn.com/bruno-a6972042/TK8cw-kedeuvaveQ/images/screenshots/visualization/handlebar.webp?fit=max&auto=format&n=TK8cw-kedeuvaveQ&q=85&s=dec5fa5f079faf041363d0741f17c56c" alt="handlebar" width="2604" height="1036" data-path="images/screenshots/visualization/handlebar.webp" />
```javascript copy theme={null}
bru.visualize('html', {
name: 'userCard',
template: '<div><h1>{{title}}</h1><p>{{message}}</p></div>',
data: { title: "Bruno", message: res.body.msg },
options: {} // optional; see Handlebars compile options below
});
```
<Warning>
Make sure to use `Post-script` while using `res.body` for visualization data.
</Warning>
Above example requires a `msg` property in the response body.
Bruno compiles **template** with **data** server-side and renders the result in the **Visualize** tab.
#### Handlebars compile options
The `options` field maps directly to [`Handlebars.compile()` options](https://handlebarsjs.com/api-reference/compilation.html). Bruno allows a safe subset:
| Option | Description |
| ------------------------ | -------------------------------------------------------------- |
| `noEscape` | Skip HTML escaping of output values. |
| `strict` | Throw on missing fields instead of rendering empty. |
| `assumeObjects` | Skip object existence checks on paths. |
| `preventIndent` | Disable auto-indent for partials. |
| `ignoreStandalone` | Disable standalone tag removal. |
| `explicitPartialContext` | Disable implicit context for partials. |
| `knownHelpersOnly` | Only allow pre-registered helpers (compile-time optimization). |
The following options are **excluded** regardless: `data`, `compat`, `knownHelpers`, `allowProtoPropertiesByDefault`, and `allowProtoMethodsByDefault` — these can alter template resolution in unexpected ways or weaken prototype-traversal protections.
**`dangerouslyAllowAllOptions`**
To bypass the allowlist entirely and pass any `Handlebars.compile()` option, set `dangerouslyAllowAllOptions: true` inside `options`:
```javascript copy theme={null}
bru.visualize('html', {
name: 'userCard',
template: '<div><h1>{{title}}</h1><p>{{body}}</p></div>',
data: { title: 'Bruno', body: res.body.msg },
options: {
strict: true,
dangerouslyAllowAllOptions: true
}
});
```
<Warning>
Use `dangerouslyAllowAllOptions` only when you fully control the template and data. Enabling excluded options like `allowProtoPropertiesByDefault` can expose prototype-traversal vulnerabilities.
</Warning>
#### `bru.clearVisualizations()`
Clears every visualization registered for the **current request** and resets the internal list (same idea as Postman’s `pm.visualizer.clear()`).
```javascript copy theme={null}
bru.clearVisualizations();
```
#### Postman `pm.visualizer` mapping
When you **import** a Postman collection, script calls are translated automatically:
| Postman | Bruno |
| -------------------------------------------- | ---------------------------------------------------------------------------------- |
| `pm.visualizer.set(template, data)` | `bru.visualize('html', { template, data })` (plus `name` when you author in Bruno) |
| `pm.visualizer.set(template, data, options)` | `bru.visualize('html', { template, data, options })` |
| `pm.visualizer.clear()` | `bru.clearVisualizations()` |
Read more from **[Postman migration](/get-started/import-export-data/postman-migration)** and **[Converters overview](/converters/overview)**.
## Examples
One of the most powerful features of `bru.visualize` is the ability to transform API responses into visual tables. Here are practical examples of working with real API data:
<Warning>
In Bruno, the parsed API response is stored in **`res.body`**
</Warning>
### Custom Dashboard with Statistics
Create rich dashboards with API data:
1. Create or use existing request.
2. Go to request -> **Script** (post-response) tab and add the following code:
3. Click on **Send** button to execute the request.
<img src="https://mintcdn.com/bruno-a6972042/TK8cw-kedeuvaveQ/images/screenshots/visualization/custom-dashboard.webp?fit=max&auto=format&n=TK8cw-kedeuvaveQ&q=85&s=243b5715de64a8dd013f0c861816a313" alt="custom dashboard" width="2838" height="1558" data-path="images/screenshots/visualization/custom-dashboard.webp" />
```javascript copy theme={null}
const apiData = res.body
const stats = {
totalRequests: apiData.length || 0,
successRate: 98.5,
avgResponseTime: 145
};
const htmlString = `
<html>
<head>
<style>
body {
font-family: 'Segoe UI', Tahoma, Geneva, Verdana, sans-serif;
padding: 20px;
background-color: #f8f9fa;
}
.dashboard {
max-width: 1200px;
margin: 0 auto;
}
.header {
text-align: center;
margin-bottom: 30px;
}
.cards {
display: grid;
grid-template-columns: repeat(auto-fit, minmax(250px, 1fr));
gap: 20px;
margin-bottom: 30px;
}
.card {
background: white;
padding: 20px;
border-radius: 8px;
box-shadow: 0 2px 4px rgba(0,0,0,0.1);
}
.card-title {
color: #666;
font-size: 14px;
margin-bottom: 10px;
}
.card-value {
font-size: 32px;
font-weight: bold;
color: #333;
}
.card-trend {
color: #4CAF50;
font-size: 14px;
margin-top: 5px;
}
</style>
</head>
<body>
<div class="dashboard">
<div class="header">
<h1>API Analytics Dashboard</h1>
<p>Last updated: ${new Date().toLocaleString()}</p>
</div>
<div class="cards">
<div class="card">
<div class="card-title">Total Requests</div>
<div class="card-value">${stats.totalRequests || 0}</div>
<div class="card-trend">↑ 12% from last week</div>
</div>
<div class="card">
<div class="card-title">Success Rate</div>
<div class="card-value">${stats.successRate || 0}%</div>
<div class="card-trend">↑ 3% improvement</div>
</div>
<div class="card">
<div class="card-title">Avg Response Time</div>
<div class="card-value">${stats.avgResponseTime || 0}ms</div>
<div class="card-trend">↓ 15ms faster</div>
</div>
</div>
</div>
</body>
</html>
`;
bru.visualize('html', {
name: 'dashboard',
content: htmlString
});
```
### Using API Response Data with Table
Render a live API response directly as an interactive table with sorting and filtering using `ag-grid`.
<img src="https://mintcdn.com/bruno-a6972042/TK8cw-kedeuvaveQ/images/screenshots/visualization/table-data.webp?fit=max&auto=format&n=TK8cw-kedeuvaveQ&q=85&s=2536477226982f1f79023e02fcee83e5" alt="table-data" width="2632" height="1614" data-path="images/screenshots/visualization/table-data.webp" />
```javascript copy theme={null}
// API URL: https://jsonplaceholder.typicode.com/users
// Bruno stores the parsed response in res.body
const users = res.body;
const rowData = users.map(user => ({
id: user.id,
name: user.name,
email: user.email,
phone: user.phone,
city: user.address.city,
company: user.company.name,
}));
const columnDefinitions = [
{ field: 'id', headerName: 'ID', width: 70, filter: false },
{ field: 'name', headerName: 'Name', filter: true, floatingFilter: true },
{ field: 'email', headerName: 'Email', filter: true, floatingFilter: true },
{ field: 'phone', headerName: 'Phone', filter: true },
{ field: 'city', headerName: 'City', filter: true, floatingFilter: true },
{ field: 'company', headerName: 'Company', filter: true, floatingFilter: true },
];
bru.visualize('table', {
name: 'usersTable',
provider: 'ag-grid',
props: { rowData, columnDefinitions }
});
```
### Bar Chart
Render a bar chart using [Chart.js](https://www.chartjs.org/) loaded via CDN. Uses static data by default — swap in `res.body` values for live API data.
<img src="https://mintcdn.com/bruno-a6972042/TK8cw-kedeuvaveQ/images/screenshots/visualization/bar-chart.webp?fit=max&auto=format&n=TK8cw-kedeuvaveQ&q=85&s=2861d3bb1c55d40eff9359cb24d0cc28" alt="bar chart" width="2628" height="1654" data-path="images/screenshots/visualization/bar-chart.webp" />
```javascript copy theme={null}
// Static data — replace with values from your API response
const labels = ['January', 'February', 'March', 'April', 'May', 'June'];
const values = [120, 95, 160, 140, 180, 210];
// To use live API data instead, replace the two lines above with:
// const labels = res.body.map(item => item.month);
// const values = res.body.map(item => item.count);
const html = `
<html>
<head>
<style>
body { margin: 0; padding: 24px; background: #1a1a2e; color: #e0e0e0; font-family: Arial, sans-serif; }
h2 { text-align: center; margin-bottom: 20px; color: #a0c4ff; }
.wrap { max-width: 680px; margin: 0 auto; }
</style>
</head>
<body>
<div class="wrap">
<h2>Monthly API Requests</h2>
<canvas id="chart"></canvas>
</div>
<script src="https://cdn.jsdelivr.net/npm/chart.js"></script>
<script>
new Chart(document.getElementById('chart'), {
type: 'bar',
data: {
labels: ${JSON.stringify(labels)},
datasets: [{
label: 'Requests',
data: ${JSON.stringify(values)},
backgroundColor: 'rgba(100, 160, 255, 0.75)',
borderColor: 'rgba(100, 160, 255, 1)',
borderWidth: 1,
borderRadius: 4
}]
},
options: {
responsive: true,
plugins: { legend: { labels: { color: '#ccc' } } },
scales: {
x: { ticks: { color: '#aaa' }, grid: { color: '#333' } },
y: { ticks: { color: '#aaa' }, grid: { color: '#333' }, beginAtZero: true }
}
}
});
</script>
</body>
</html>
`;
bru.visualize('html', { name: 'barChart', content: html });
```
### Pie Chart
Render a pie chart using [Chart.js](https://www.chartjs.org/) via CDN. Uses static data by default — swap in `res.body` values for live API data.
<img src="https://mintcdn.com/bruno-a6972042/TK8cw-kedeuvaveQ/images/screenshots/visualization/pie-chart.webp?fit=max&auto=format&n=TK8cw-kedeuvaveQ&q=85&s=210b6a4ca660e8922786651edcbcb1b3" alt="pie chart" width="1912" height="1366" data-path="images/screenshots/visualization/pie-chart.webp" />
```javascript copy theme={null}
// Static data — replace with values from your API response
const labels = ['GET', 'POST', 'PUT', 'DELETE', 'PATCH'];
const values = [540, 320, 180, 95, 65];
// To use live API data instead, replace the two lines above with:
// const labels = res.body.map(item => item.method);
// const values = res.body.map(item => item.count);
const html = `
<html>
<head>
<style>
body { margin: 0; padding: 24px; background: #1a1a2e; color: #e0e0e0; font-family: Arial, sans-serif; }
h2 { text-align: center; margin-bottom: 20px; color: #a0c4ff; }
.wrap { max-width: 480px; margin: 0 auto; }
</style>
</head>
<body>
<div class="wrap">
<h2>API Requests by Method</h2>
<canvas id="chart"></canvas>
</div>
<script src="https://cdn.jsdelivr.net/npm/chart.js"></script>
<script>
new Chart(document.getElementById('chart'), {
type: 'pie',
data: {
labels: ${JSON.stringify(labels)},
datasets: [{
data: ${JSON.stringify(values)},
backgroundColor: [
'rgba(100, 160, 255, 0.85)',
'rgba(255, 140, 100, 0.85)',
'rgba(100, 220, 160, 0.85)',
'rgba(255, 100, 130, 0.85)',
'rgba(200, 160, 255, 0.85)'
],
borderColor: '#1a1a2e',
borderWidth: 2
}]
},
options: {
responsive: true,
plugins: {
legend: {
position: 'bottom',
labels: { color: '#ccc', padding: 16 }
}
}
}
});
</script>
</body>
</html>
`;
bru.visualize('html', { name: 'pieChart', content: html });
```
```javascript copy theme={null}
const rowData = [
{ name: 'John Doe', age: 28, email: 'john@example.com', city: 'New York' },
{ name: 'Jane Smith', age: 32, email: 'jane@example.com', city: 'London' },
];
const columnDefinitions = [
{ id: 'name', header: 'name', cell: (info) => info.getValue(), meta: { filterVariant: 'text' } },
{ id: 'age', header: 'age', cell: (info) => info.getValue(), meta: { filterVariant: 'range' } },
{ id: 'email', header: 'email', cell: (info) => info.getValue(), meta: { filterVariant: 'text' } },
{ id: 'city', header: 'city', cell: (info) => info.getValue(), meta: { filterVariant: 'text' } },
];
bru.visualize('table', {
name: 'table2',
provider: 'react-table',
props: { rowData, columnDefinitions }
});
```
The `header` property only accepts **string values**. Use strings like `header: "Column Name"`.
This renders a table with text and range filters. `filterVariant: 'text'` adds a search box; `filterVariant: 'range'` adds Min/Max inputs.
### HTML visualization (`'html'`)
You can render either **raw HTML** or a **Handlebars** template with structured **data**.
**Synatx**
```js theme={null}
bru.visualize('html', { // type
name: '', // name of the visualization
content: `<raw-html>` // or <template>, <data>, <options> (handlebars)
});
```
#### Raw HTML (`content`)
You can pass a full HTML string to the `content` property to render a raw HTML.
*Example:*
<img src="https://mintcdn.com/bruno-a6972042/QYCaSeVC3onHpqpv/images/screenshots/visualization/html.webp?fit=max&auto=format&n=QYCaSeVC3onHpqpv&q=85&s=f1a715f5a5e261d340bdbd11b193ccfd" alt="html" width="1152" height="200" data-path="images/screenshots/visualization/html.webp" />
```javascript copy theme={null}
const htmlString = `
<html>
<head>
<style>
table { width: 100%; border-collapse: collapse; }
th, td { border: 1px solid #888888; padding: 8px; color: #cccccc; }
th { background-color: #555555; color: #ffffff; }
</style>
</head>
<body>
<table>
<tr><th>Name</th><th>Age</th><th>Email</th><th>City</th></tr>
<tr><td>John Doe</td><td>28</td><td>john@example.com</td><td>New York</td></tr>
<tr><td>Jane Smith</td><td>32</td><td>jane@example.com</td><td>London</td></tr>
</table>
</body>
</html>
`;
bru.visualize('html', {
name: 'htmlReport',
content: htmlString
});
```
This example will render an HTML table with predefined data using the html type.
#### Handlebars template (`template`, `data`, `options`)
Use Handlebars when you want a small template plus JSON data instead of building HTML strings in script:
<img src="https://mintcdn.com/bruno-a6972042/TK8cw-kedeuvaveQ/images/screenshots/visualization/handlebar.webp?fit=max&auto=format&n=TK8cw-kedeuvaveQ&q=85&s=dec5fa5f079faf041363d0741f17c56c" alt="handlebar" width="2604" height="1036" data-path="images/screenshots/visualization/handlebar.webp" />
```javascript copy theme={null}
bru.visualize('html', {
name: 'userCard',
template: '<div><h1>{{title}}</h1><p>{{message}}</p></div>',
data: { title: "Bruno", message: res.body.msg },
options: {} // optional; see Handlebars compile options below
});
```
<Warning>
Make sure to use `Post-script` while using `res.body` for visualization data.
</Warning>
Above example requires a `msg` property in the response body.
Bruno compiles **template** with **data** server-side and renders the result in the **Visualize** tab.
#### Handlebars compile options
The `options` field maps directly to [`Handlebars.compile()` options](https://handlebarsjs.com/api-reference/compilation.html). Bruno allows a safe subset:
| Option | Description |
| ------------------------ | -------------------------------------------------------------- |
| `noEscape` | Skip HTML escaping of output values. |
| `strict` | Throw on missing fields instead of rendering empty. |
| `assumeObjects` | Skip object existence checks on paths. |
| `preventIndent` | Disable auto-indent for partials. |
| `ignoreStandalone` | Disable standalone tag removal. |
| `explicitPartialContext` | Disable implicit context for partials. |
| `knownHelpersOnly` | Only allow pre-registered helpers (compile-time optimization). |
The following options are **excluded** regardless: `data`, `compat`, `knownHelpers`, `allowProtoPropertiesByDefault`, and `allowProtoMethodsByDefault` — these can alter template resolution in unexpected ways or weaken prototype-traversal protections.
**`dangerouslyAllowAllOptions`**
To bypass the allowlist entirely and pass any `Handlebars.compile()` option, set `dangerouslyAllowAllOptions: true` inside `options`:
```javascript copy theme={null}
bru.visualize('html', {
name: 'userCard',
template: '<div><h1>{{title}}</h1><p>{{body}}</p></div>',
data: { title: 'Bruno', body: res.body.msg },
options: {
strict: true,
dangerouslyAllowAllOptions: true
}
});
```
<Warning>
Use `dangerouslyAllowAllOptions` only when you fully control the template and data. Enabling excluded options like `allowProtoPropertiesByDefault` can expose prototype-traversal vulnerabilities.
</Warning>
#### `bru.clearVisualizations()`
Clears every visualization registered for the **current request** and resets the internal list (same idea as Postman’s `pm.visualizer.clear()`).
```javascript copy theme={null}
bru.clearVisualizations();
```
#### Postman `pm.visualizer` mapping
When you **import** a Postman collection, script calls are translated automatically:
| Postman | Bruno |
| -------------------------------------------- | ---------------------------------------------------------------------------------- |
| `pm.visualizer.set(template, data)` | `bru.visualize('html', { template, data })` (plus `name` when you author in Bruno) |
| `pm.visualizer.set(template, data, options)` | `bru.visualize('html', { template, data, options })` |
| `pm.visualizer.clear()` | `bru.clearVisualizations()` |
Read more from **[Postman migration](/get-started/import-export-data/postman-migration)** and **[Converters overview](/converters/overview)**.
## Examples
One of the most powerful features of `bru.visualize` is the ability to transform API responses into visual tables. Here are practical examples of working with real API data:
<Warning>
In Bruno, the parsed API response is stored in **`res.body`**
</Warning>
### Custom Dashboard with Statistics
Create rich dashboards with API data:
1. Create or use existing request.
2. Go to request -> **Script** (post-response) tab and add the following code:
3. Click on **Send** button to execute the request.
<img src="https://mintcdn.com/bruno-a6972042/TK8cw-kedeuvaveQ/images/screenshots/visualization/custom-dashboard.webp?fit=max&auto=format&n=TK8cw-kedeuvaveQ&q=85&s=243b5715de64a8dd013f0c861816a313" alt="custom dashboard" width="2838" height="1558" data-path="images/screenshots/visualization/custom-dashboard.webp" />
```javascript copy theme={null}
const apiData = res.body
const stats = {
totalRequests: apiData.length || 0,
successRate: 98.5,
avgResponseTime: 145
};
const htmlString = `
<html>
<head>
<style>
body {
font-family: 'Segoe UI', Tahoma, Geneva, Verdana, sans-serif;
padding: 20px;
background-color: #f8f9fa;
}
.dashboard {
max-width: 1200px;
margin: 0 auto;
}
.header {
text-align: center;
margin-bottom: 30px;
}
.cards {
display: grid;
grid-template-columns: repeat(auto-fit, minmax(250px, 1fr));
gap: 20px;
margin-bottom: 30px;
}
.card {
background: white;
padding: 20px;
border-radius: 8px;
box-shadow: 0 2px 4px rgba(0,0,0,0.1);
}
.card-title {
color: #666;
font-size: 14px;
margin-bottom: 10px;
}
.card-value {
font-size: 32px;
font-weight: bold;
color: #333;
}
.card-trend {
color: #4CAF50;
font-size: 14px;
margin-top: 5px;
}
</style>
</head>
<body>
<div class="dashboard">
<div class="header">
<h1>API Analytics Dashboard</h1>
<p>Last updated: ${new Date().toLocaleString()}</p>
</div>
<div class="cards">
<div class="card">
<div class="card-title">Total Requests</div>
<div class="card-value">${stats.totalRequests || 0}</div>
<div class="card-trend">↑ 12% from last week</div>
</div>
<div class="card">
<div class="card-title">Success Rate</div>
<div class="card-value">${stats.successRate || 0}%</div>
<div class="card-trend">↑ 3% improvement</div>
</div>
<div class="card">
<div class="card-title">Avg Response Time</div>
<div class="card-value">${stats.avgResponseTime || 0}ms</div>
<div class="card-trend">↓ 15ms faster</div>
</div>
</div>
</div>
</body>
</html>
`;
bru.visualize('html', {
name: 'dashboard',
content: htmlString
});
```
### Using API Response Data with Table
Render a live API response directly as an interactive table with sorting and filtering using `ag-grid`.
<img src="https://mintcdn.com/bruno-a6972042/TK8cw-kedeuvaveQ/images/screenshots/visualization/table-data.webp?fit=max&auto=format&n=TK8cw-kedeuvaveQ&q=85&s=2536477226982f1f79023e02fcee83e5" alt="table-data" width="2632" height="1614" data-path="images/screenshots/visualization/table-data.webp" />
```javascript copy theme={null}
// API URL: https://jsonplaceholder.typicode.com/users
// Bruno stores the parsed response in res.body
const users = res.body;
const rowData = users.map(user => ({
id: user.id,
name: user.name,
email: user.email,
phone: user.phone,
city: user.address.city,
company: user.company.name,
}));
const columnDefinitions = [
{ field: 'id', headerName: 'ID', width: 70, filter: false },
{ field: 'name', headerName: 'Name', filter: true, floatingFilter: true },
{ field: 'email', headerName: 'Email', filter: true, floatingFilter: true },
{ field: 'phone', headerName: 'Phone', filter: true },
{ field: 'city', headerName: 'City', filter: true, floatingFilter: true },
{ field: 'company', headerName: 'Company', filter: true, floatingFilter: true },
];
bru.visualize('table', {
name: 'usersTable',
provider: 'ag-grid',
props: { rowData, columnDefinitions }
});
```
### Bar Chart
Render a bar chart using [Chart.js](https://www.chartjs.org/) loaded via CDN. Uses static data by default — swap in `res.body` values for live API data.
<img src="https://mintcdn.com/bruno-a6972042/TK8cw-kedeuvaveQ/images/screenshots/visualization/bar-chart.webp?fit=max&auto=format&n=TK8cw-kedeuvaveQ&q=85&s=2861d3bb1c55d40eff9359cb24d0cc28" alt="bar chart" width="2628" height="1654" data-path="images/screenshots/visualization/bar-chart.webp" />
```javascript copy theme={null}
// Static data — replace with values from your API response
const labels = ['January', 'February', 'March', 'April', 'May', 'June'];
const values = [120, 95, 160, 140, 180, 210];
// To use live API data instead, replace the two lines above with:
// const labels = res.body.map(item => item.month);
// const values = res.body.map(item => item.count);
const html = `
<html>
<head>
<style>
body { margin: 0; padding: 24px; background: #1a1a2e; color: #e0e0e0; font-family: Arial, sans-serif; }
h2 { text-align: center; margin-bottom: 20px; color: #a0c4ff; }
.wrap { max-width: 680px; margin: 0 auto; }
</style>
</head>
<body>
<div class="wrap">
<h2>Monthly API Requests</h2>
<canvas id="chart"></canvas>
</div>
<script src="https://cdn.jsdelivr.net/npm/chart.js"></script>
<script>
new Chart(document.getElementById('chart'), {
type: 'bar',
data: {
labels: ${JSON.stringify(labels)},
datasets: [{
label: 'Requests',
data: ${JSON.stringify(values)},
backgroundColor: 'rgba(100, 160, 255, 0.75)',
borderColor: 'rgba(100, 160, 255, 1)',
borderWidth: 1,
borderRadius: 4
}]
},
options: {
responsive: true,
plugins: { legend: { labels: { color: '#ccc' } } },
scales: {
x: { ticks: { color: '#aaa' }, grid: { color: '#333' } },
y: { ticks: { color: '#aaa' }, grid: { color: '#333' }, beginAtZero: true }
}
}
});
</script>
</body>
</html>
`;
bru.visualize('html', { name: 'barChart', content: html });
```
### Pie Chart
Render a pie chart using [Chart.js](https://www.chartjs.org/) via CDN. Uses static data by default — swap in `res.body` values for live API data.
<img src="https://mintcdn.com/bruno-a6972042/TK8cw-kedeuvaveQ/images/screenshots/visualization/pie-chart.webp?fit=max&auto=format&n=TK8cw-kedeuvaveQ&q=85&s=210b6a4ca660e8922786651edcbcb1b3" alt="pie chart" width="1912" height="1366" data-path="images/screenshots/visualization/pie-chart.webp" />
```javascript copy theme={null}
// Static data — replace with values from your API response
const labels = ['GET', 'POST', 'PUT', 'DELETE', 'PATCH'];
const values = [540, 320, 180, 95, 65];
// To use live API data instead, replace the two lines above with:
// const labels = res.body.map(item => item.method);
// const values = res.body.map(item => item.count);
const html = `
<html>
<head>
<style>
body { margin: 0; padding: 24px; background: #1a1a2e; color: #e0e0e0; font-family: Arial, sans-serif; }
h2 { text-align: center; margin-bottom: 20px; color: #a0c4ff; }
.wrap { max-width: 480px; margin: 0 auto; }
</style>
</head>
<body>
<div class="wrap">
<h2>API Requests by Method</h2>
<canvas id="chart"></canvas>
</div>
<script src="https://cdn.jsdelivr.net/npm/chart.js"></script>
<script>
new Chart(document.getElementById('chart'), {
type: 'pie',
data: {
labels: ${JSON.stringify(labels)},
datasets: [{
data: ${JSON.stringify(values)},
backgroundColor: [
'rgba(100, 160, 255, 0.85)',
'rgba(255, 140, 100, 0.85)',
'rgba(100, 220, 160, 0.85)',
'rgba(255, 100, 130, 0.85)',
'rgba(200, 160, 255, 0.85)'
],
borderColor: '#1a1a2e',
borderWidth: 2
}]
},
options: {
responsive: true,
plugins: {
legend: {
position: 'bottom',
labels: { color: '#ccc', padding: 16 }
}
}
}
});
</script>
</body>
</html>
`;
bru.visualize('html', { name: 'pieChart', content: html });
```